

Trading
Explore a wide range of markets with competitive pricing, deep liquidity, and advanced trading tools.
Learn More 
Platform
Trade seamlessly with TMGM's powerful platform, built for speed, precision, and a superior trading experience.
Learn More Trading Platform
Academy
Learn the fundamentals of trading with beginner-friendly resources, including guides, webinars, and market insights.
Learn More News & Analysis
Get real-time market updates and expert analysis to stay ahead of trading opportunities
Learn More News & Analysis
About
Learn what sets TMGM apart — our global presence, regulatory strength, and commitment to innovation in trading.
Learn More Why Choose TMGM
Sponsorship
50-day EMA: Bitcoin holds support while Ethereum and XRP encounter structural resistance | Crypto Today
- $81,000 is back below Bitcoin on Friday. The advance follows a successful defence of support at the 50-day EMA.
- $2,400 remains Ethereum’s broad consolidation area, with the price resting on a cluster of medium- and long-term moving averages.
- $1.32 is back below XRP as it rebounds after Thursday’s steep sell-off tested demand at $1.30.
$81,000 is back below Bitcoin (BTC) as it edges higher on Friday. A recent successful defence of structural support near $80,000 has strengthened the Crypto King’s existing bullish outlook. Ethereum (ETH) is also making modest gains above $2,400. Ripple (XRP), meanwhile, trades above $1.32 following a test of support around $1.30.

3.75-4.00% Fed rate range in focus
A Wednesday hold at 3.75-4.00% remains the widely expected outcome for Federal Reserve (Fed) interest rates. Following September’s 25-basis-point increase, market pricing assigns about a 92% probability that the Federal Open Market Committee (FOMC) will leave rates unchanged.
An October rate increase carries an 8% probability, according to the FedWatch Tool. The likelihood of a rise is higher for December.
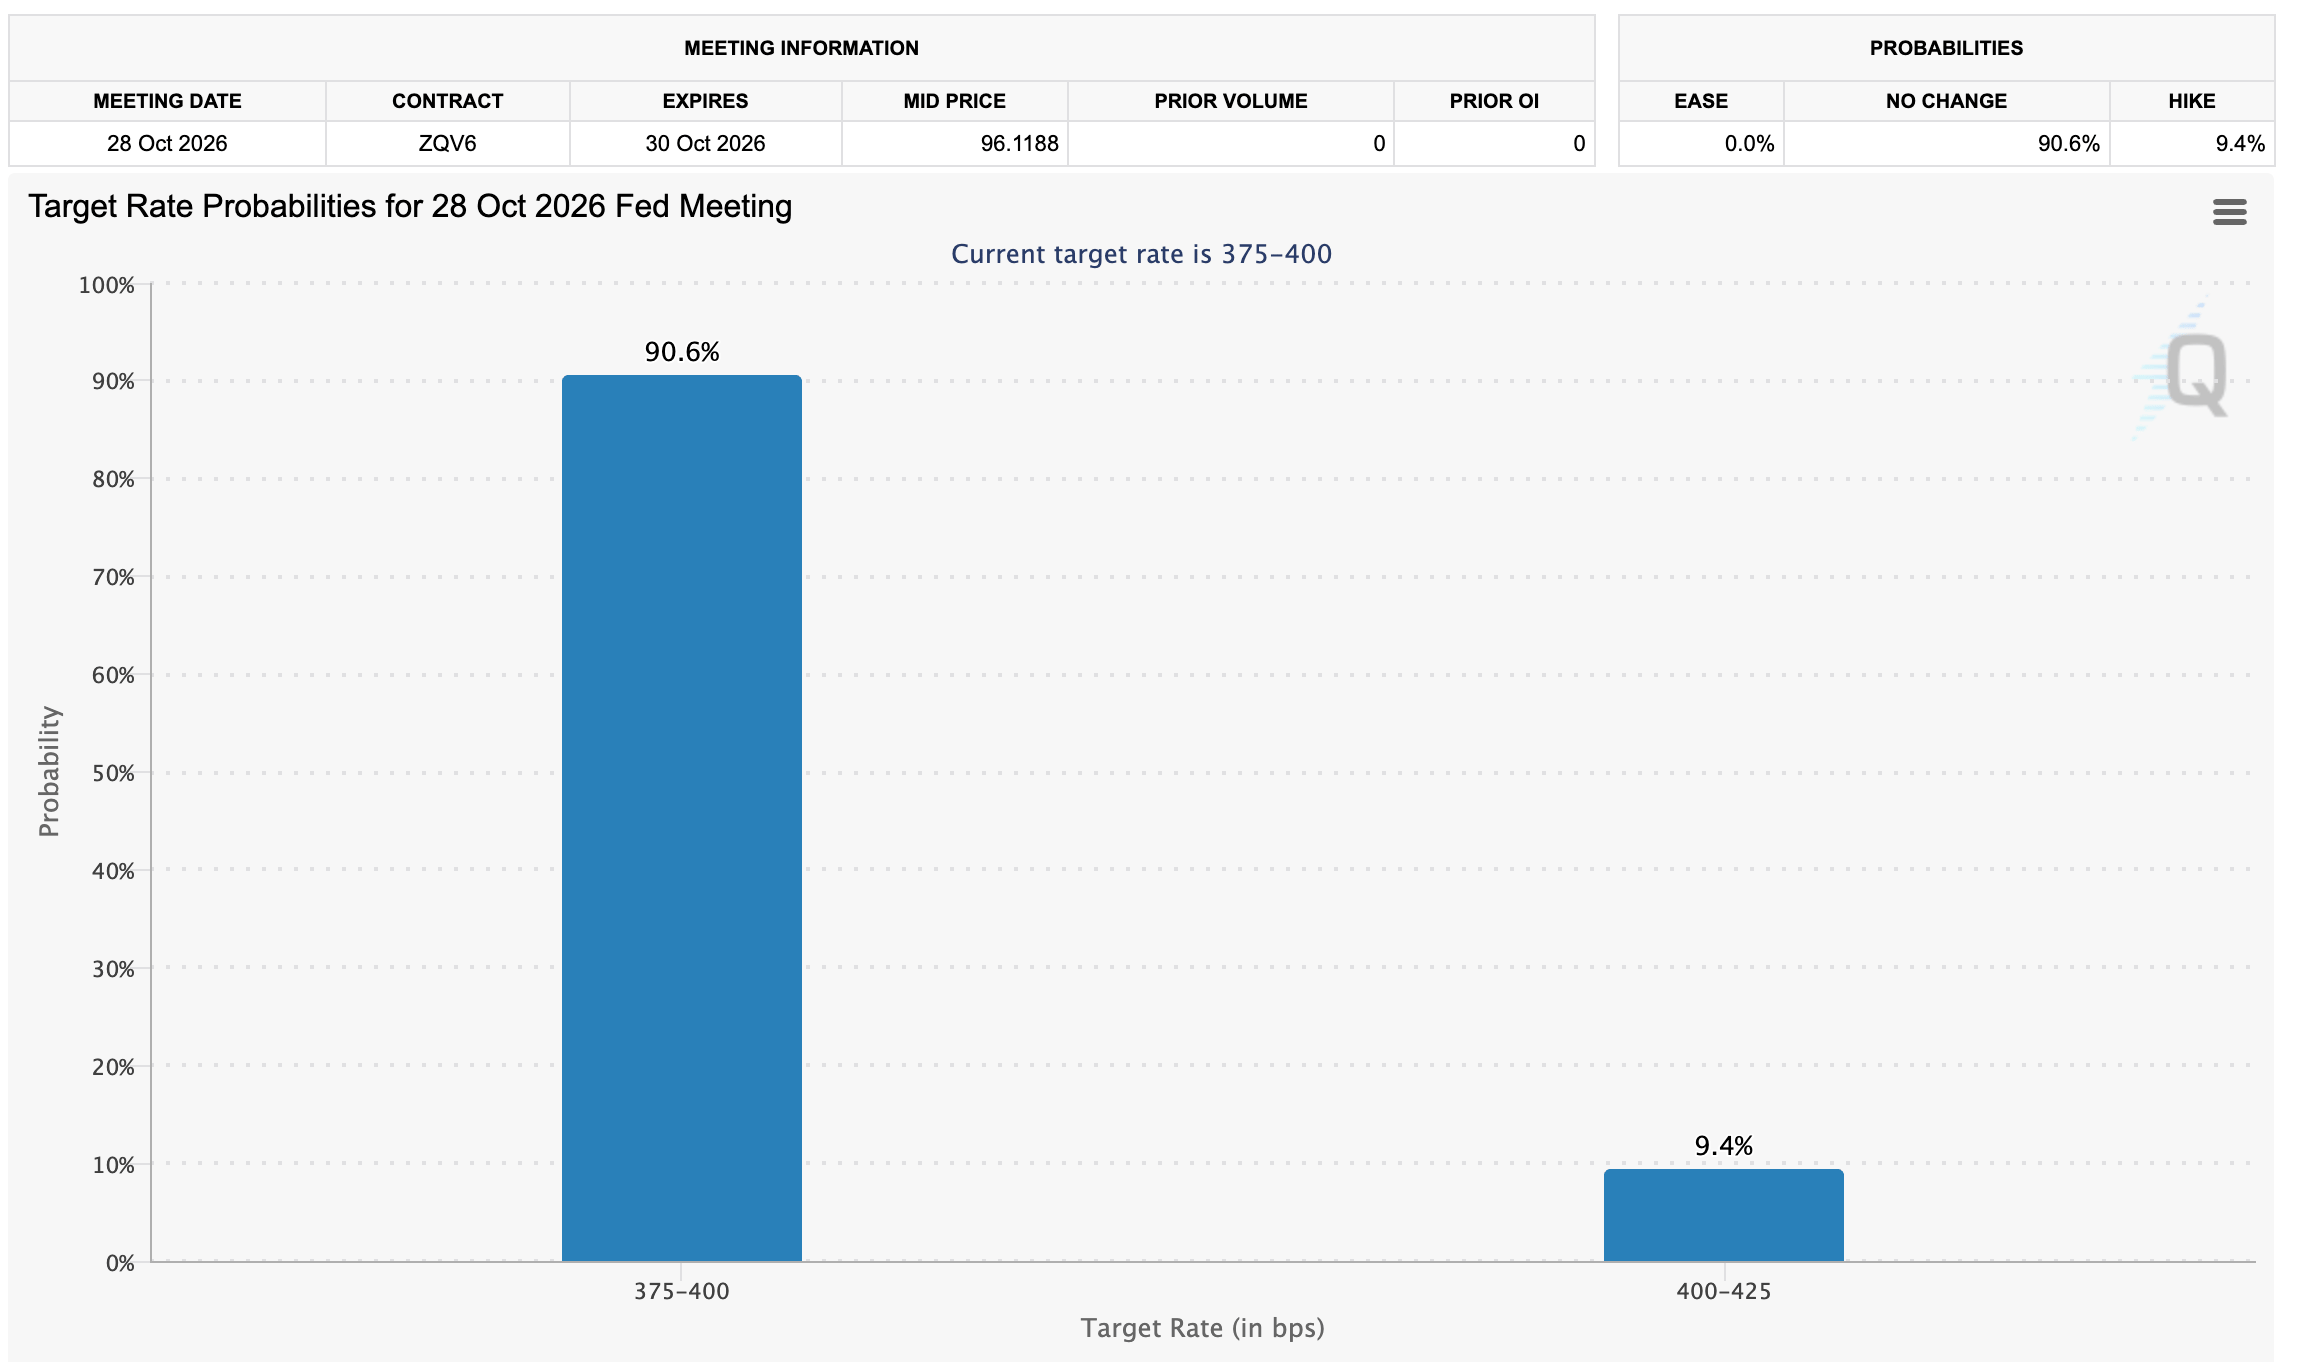
In an analysis report sent by email, Crypto Finance said: "The FOMC meets 27-28 October, with the decision on Wednesday, 28 October. With inflation risk still elevated and risk assets already tightening financial conditions, the market will watch closely for any shift in the Fed's reaction function,"
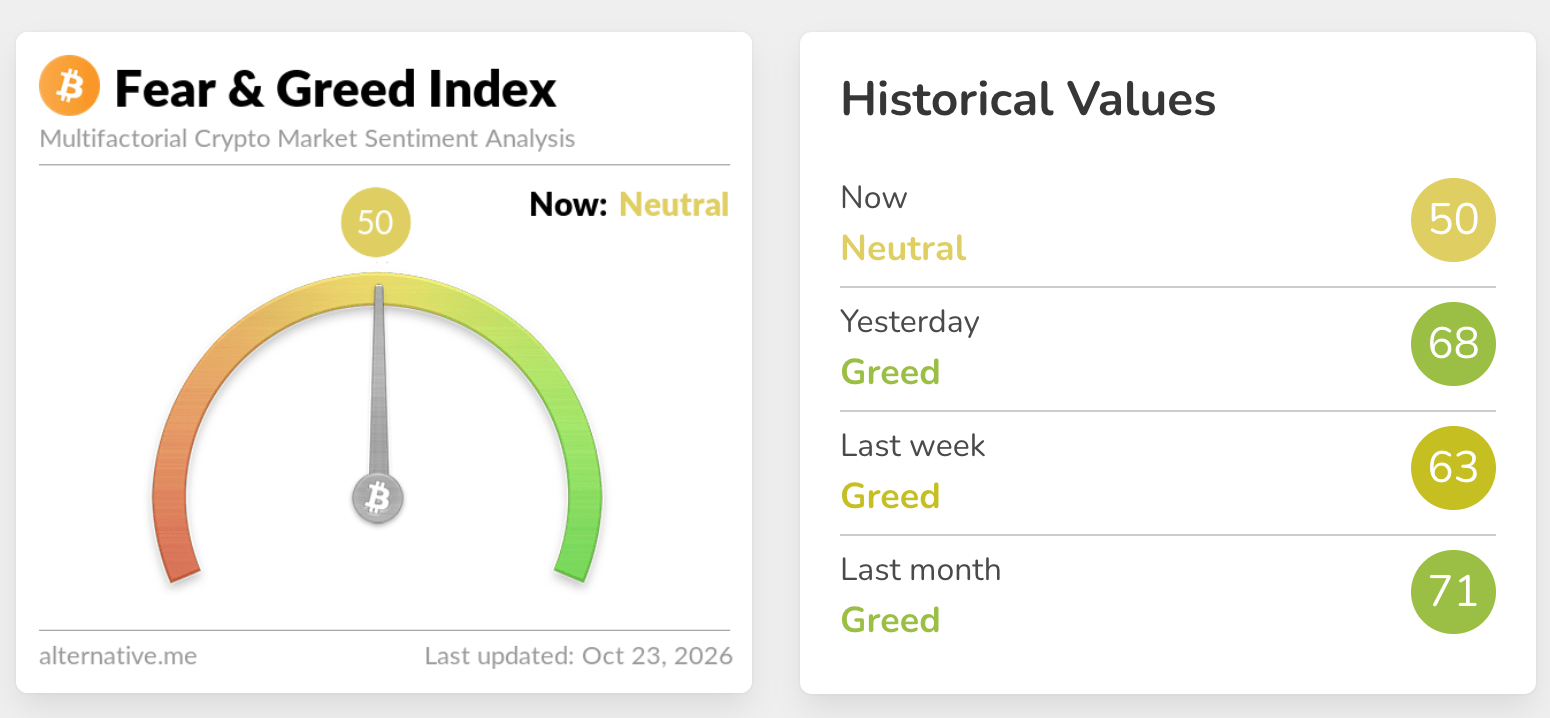
Demand for digital asset investment products has weakened this week. Reflecting that retreat, the crypto Fear & Greed Index fell to 50, in Neutral territory, on Friday from 68, in the Greed range, a day earlier. The decline coincides with increased volatility before the Fed decision. Investors are staying on the sidelines until the central bank’s policy direction becomes clear.
$81,862 Bitcoin price retains bullish technical outlook
At $81,862, Bitcoin remains above its key Exponential Moving Averages (EMAs), maintaining a bullish short-term outlook. Below the spot price, the 50-day EMA around $80,879 and SuperTrend line near $79,664 provide successive layers of dynamic support. The wider uptrend structure also draws support from the 100-day EMA at $77,529 and 200-day EMA at $76,209.
The momentum picture is less convincing. With the Relative Strength Index (RSI) just below 50 and the Moving Average Convergence Divergence (MACD) indicator still in negative territory, further gains may develop slowly and resemble a corrective move rather than an impulsive advance.
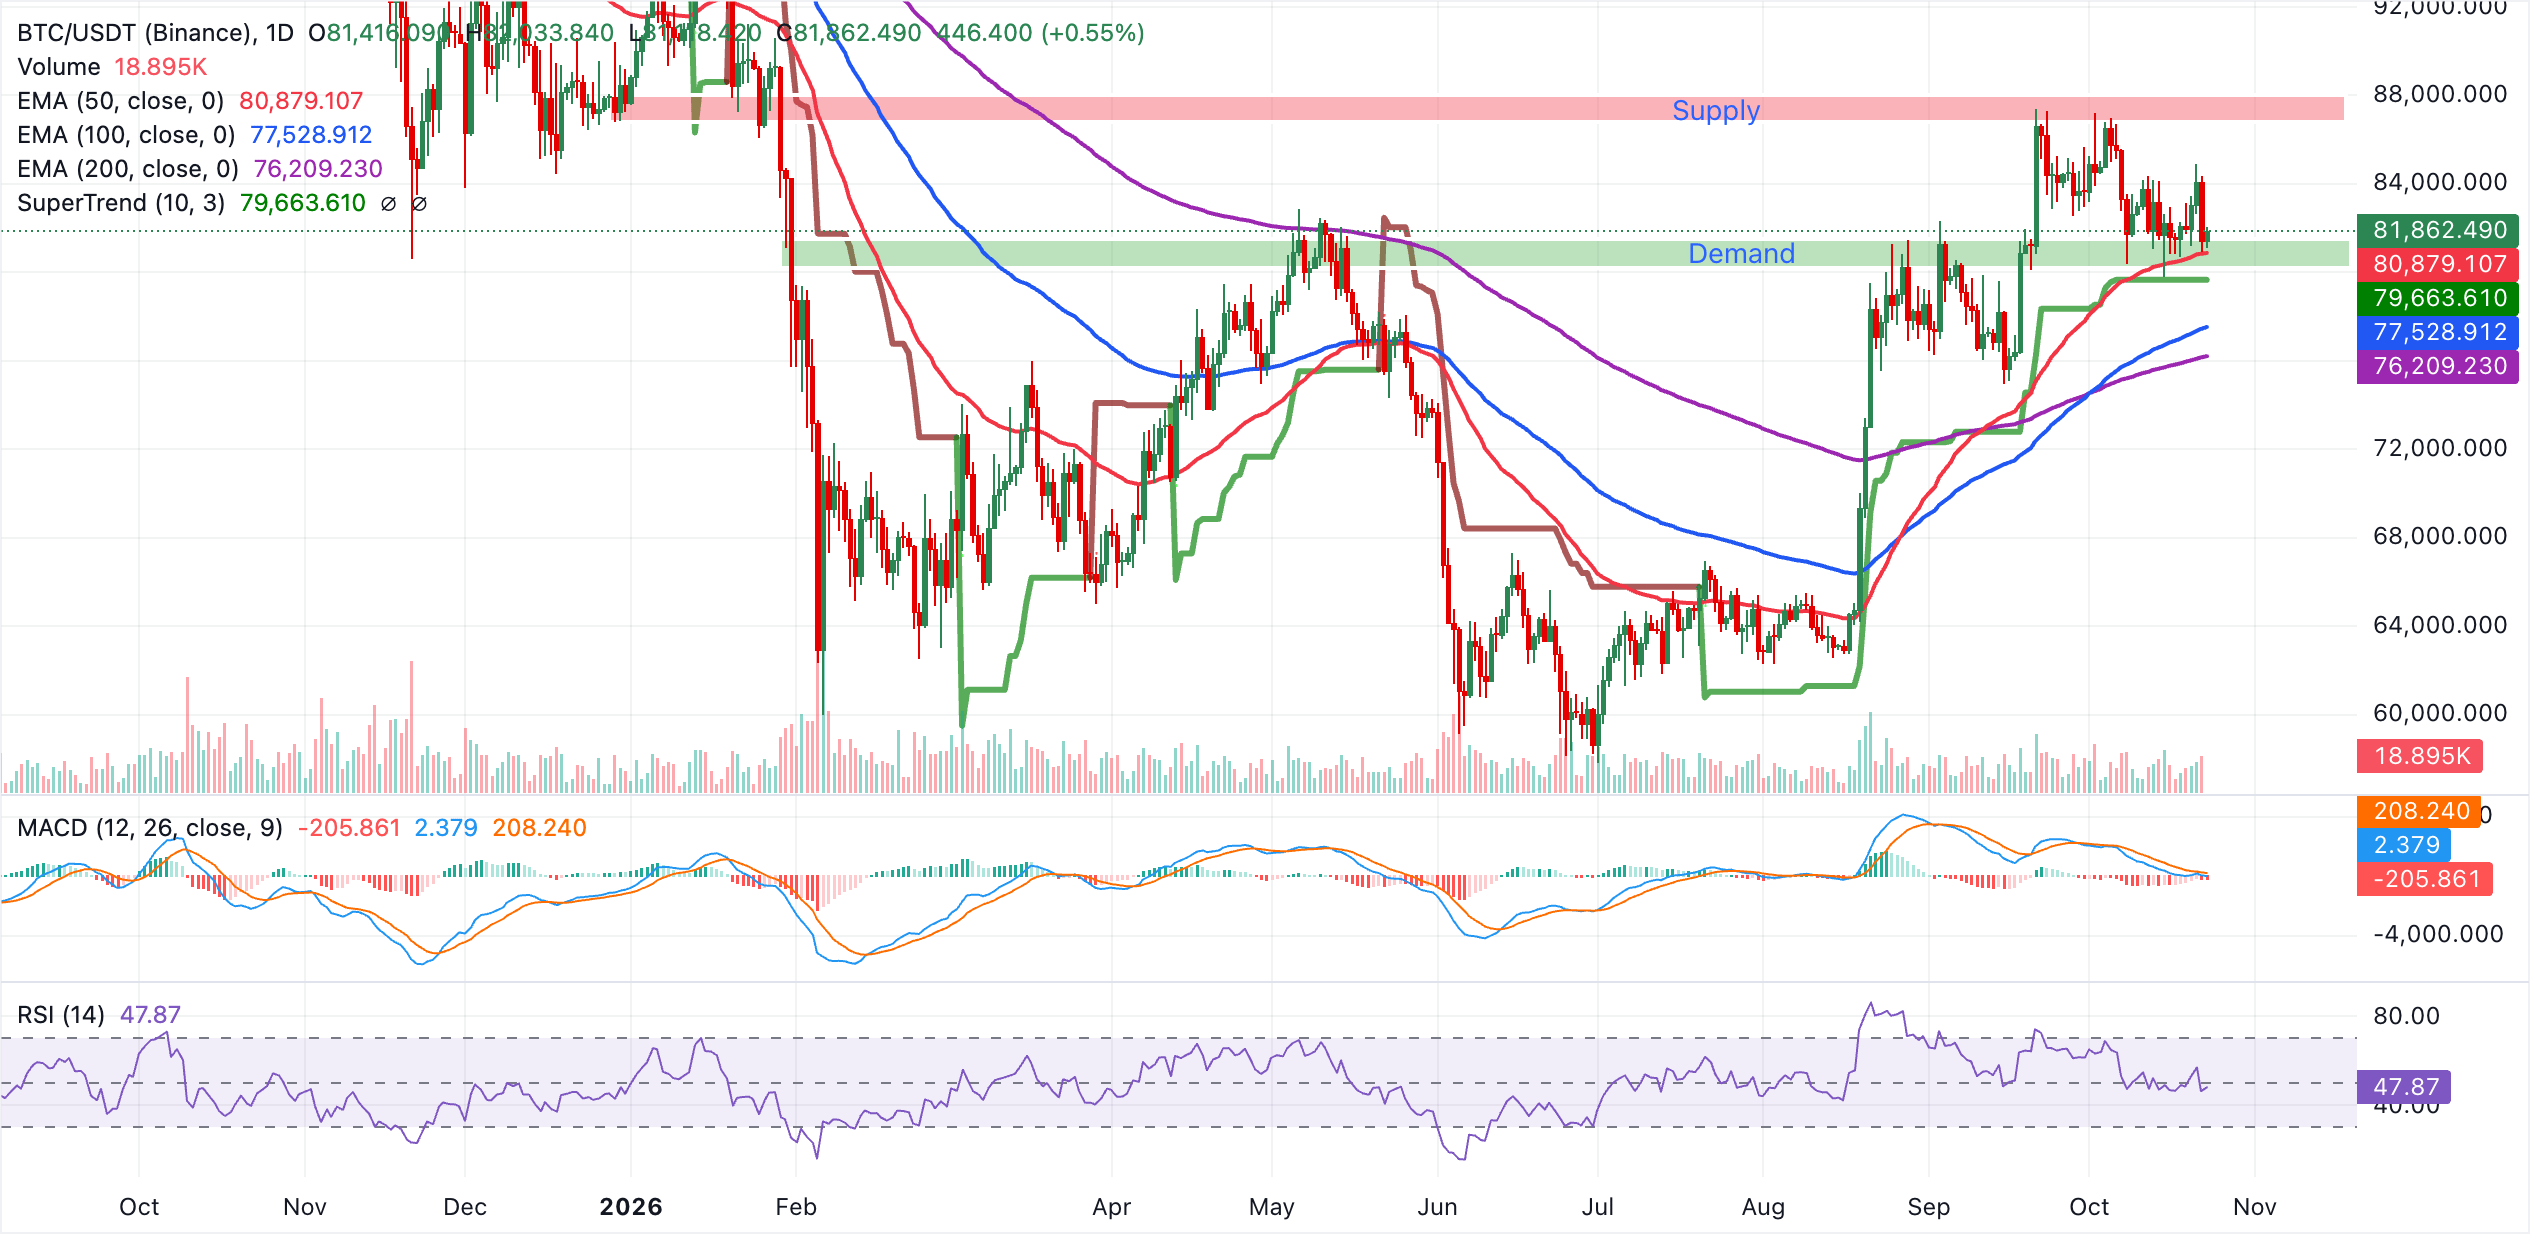
The first support level is the 50-day EMA at $80,879. Next comes the SuperTrend baseline at $79,664, where buyers may attempt to protect the existing bullish structure. A larger retreat would bring the 100-day EMA at $77,529 into view, followed by another support layer at the 200-day EMA of $76,209.
No indicator-defined resistance is evident on the daily chart, leaving the ability to stay above the EMA cluster as the main focus. Holding above the 50-day EMA would preserve scope for a gradual return to the broader uptrend. Conversely, a daily close below it would undermine the positive outlook.
Crypto Finance also said: "The $80,000-$81,000 area remains the line bulls have repeatedly defended, while $83,000 is the first level that would suggest buyers are beginning to regain control. Beyond that, the $85-$87,000 area remains the larger resistance zone that capped the September and early-October rally,"
$2,410 Ethereum and $1.32 XRP target near-term technical recovery
At $2,410, Ethereum is holding above its 100-day EMA at $2,365 and 200-day EMA at $2,317, preserving a mildly positive short-term outlook. The price has recovered the area near $2,368 where the rising support trendline was broken. However, attempts to advance remain constrained: Ethereum is still below the 50-period EMA at $2,475 and SuperTrend resistance at $2,675.
A slight improvement in the MACD has not lifted it above zero, while the RSI stands around 41. Together, these readings point to stabilisation rather than forceful bullish momentum.
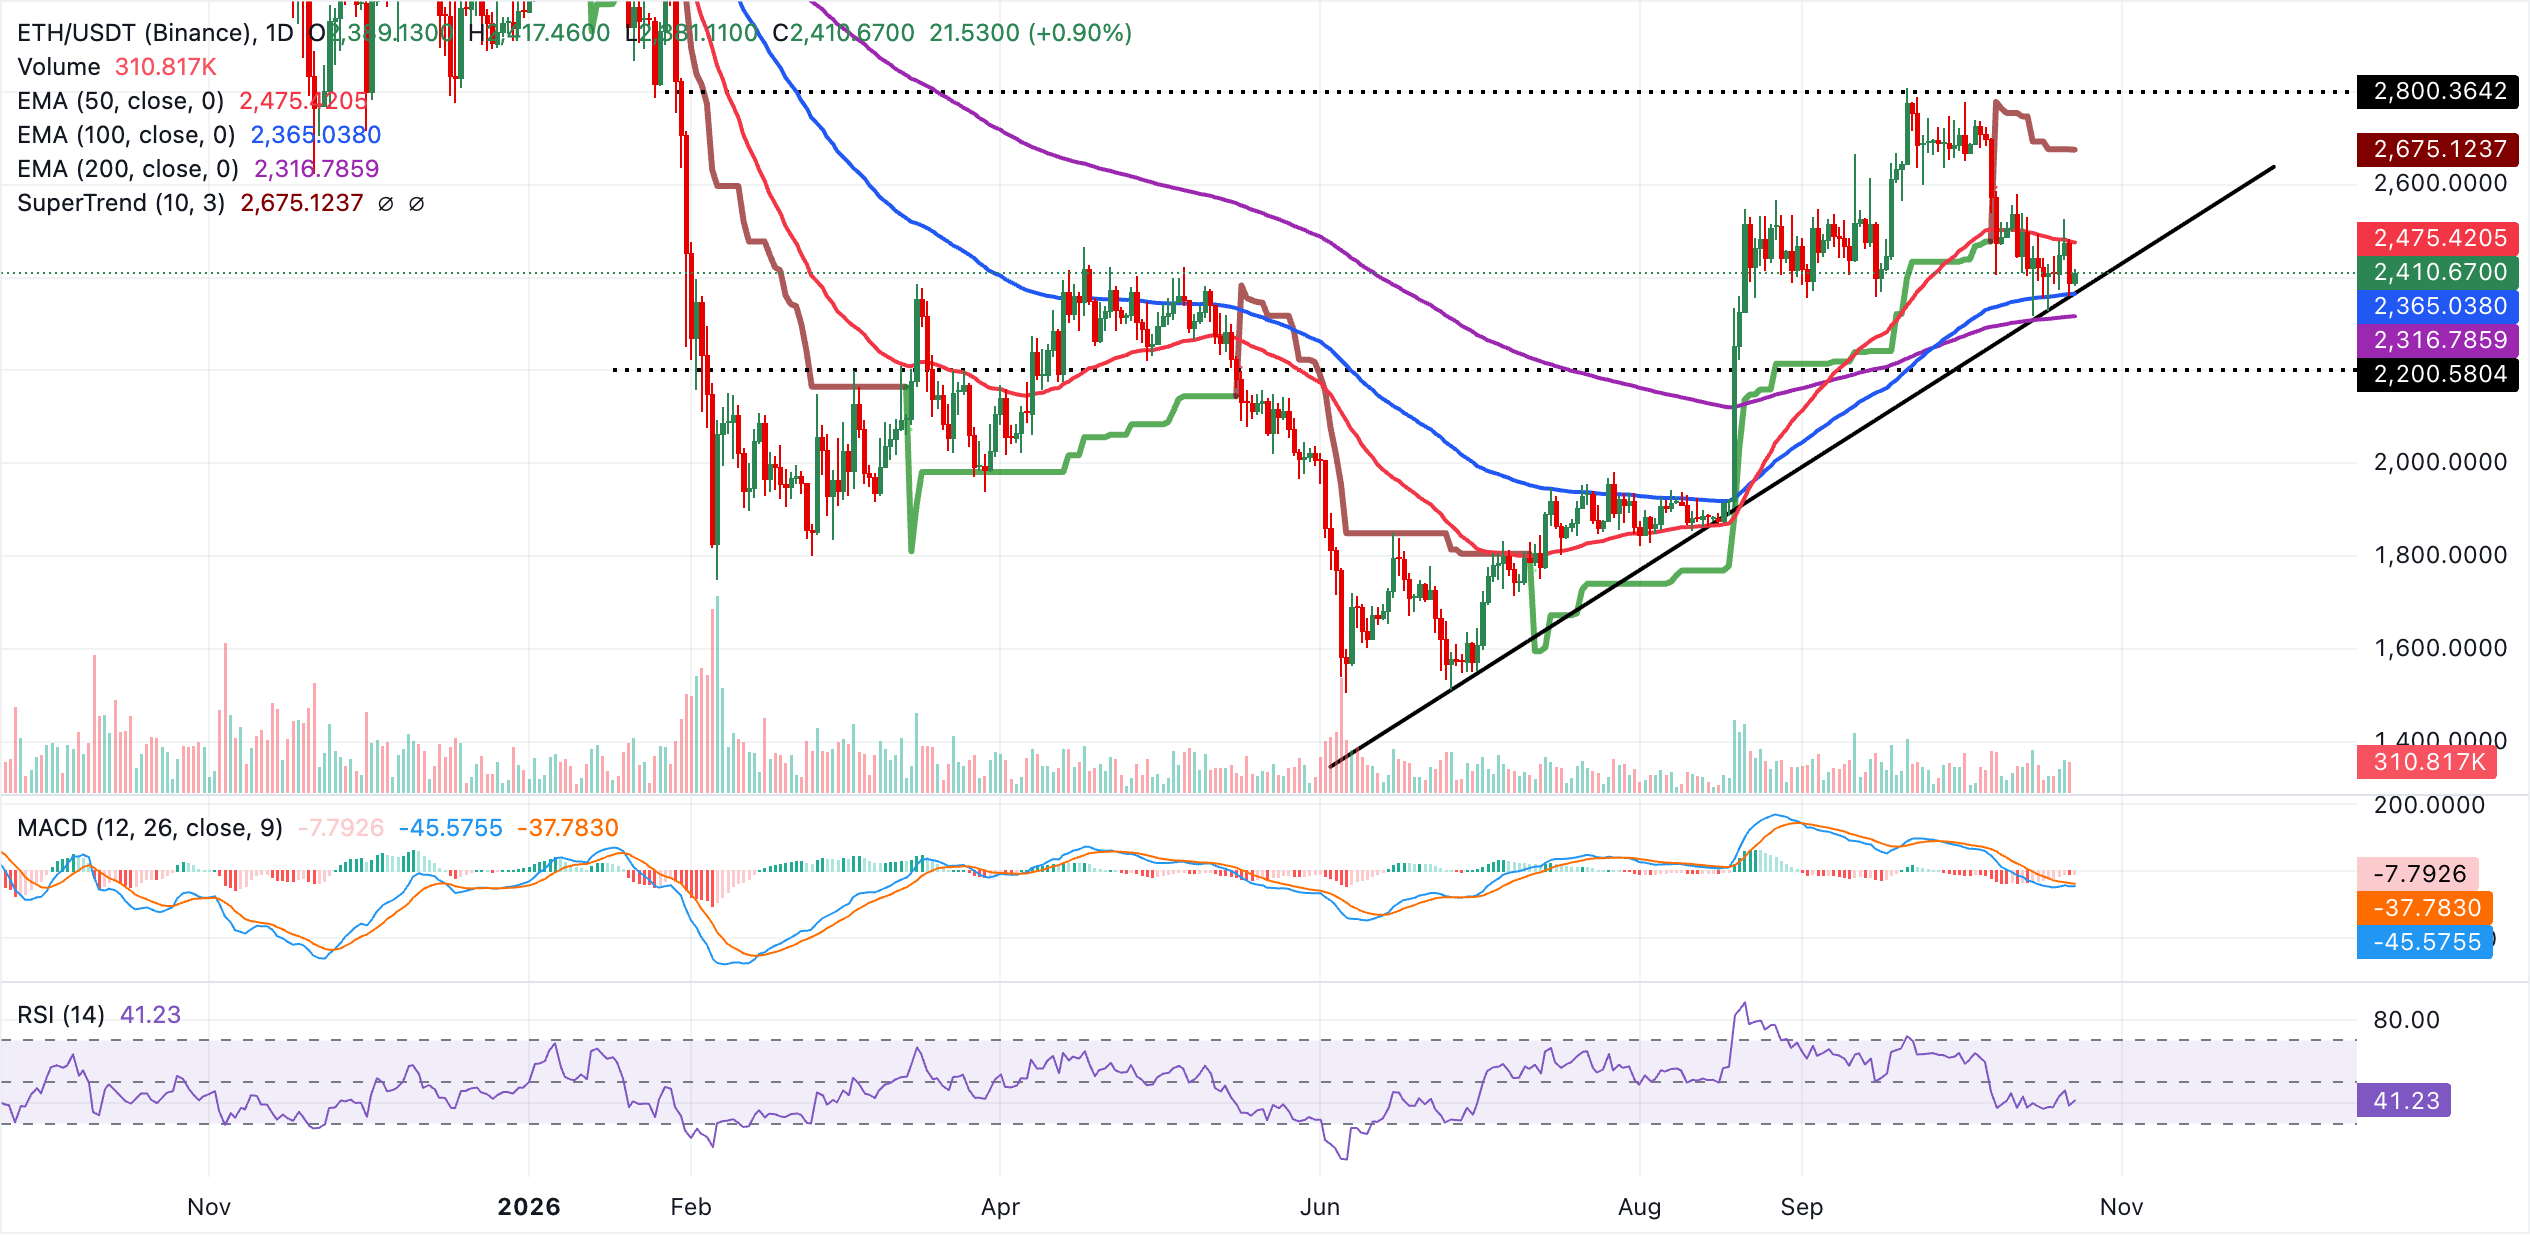
The recovered trendline area around $2,368 offers the nearest support, closely followed by the 100-EMA at $2,365. Below that, the 200-EMA near $2,317 is another level where buyers may try to preserve the broader uptrend structure.
On the upside, the 50-EMA around $2,475 is the first resistance level, followed by the more substantial SuperTrend barrier near $2,675. Clearing these levels on a daily closing basis would create scope for a more decisive bullish extension. If the $2,368-$2,365 support cluster fails to hold, attention would instead return to the $2,317 area.
Despite its recent rebound from lower levels, XRP retains a bearish broader outlook at $1.32. Pressure persists because the price remains below the 100-day EMA at $1.34, the 50-day EMA at $1.37 and the 200-day EMA at $1.38.
Well above the spot price, the SuperTrend indicator at $1.47 adds weight to the existing downtrend. The RSI has recovered from oversold territory to near 43, but this still points to only limited bullish momentum within a predominantly bearish structure.
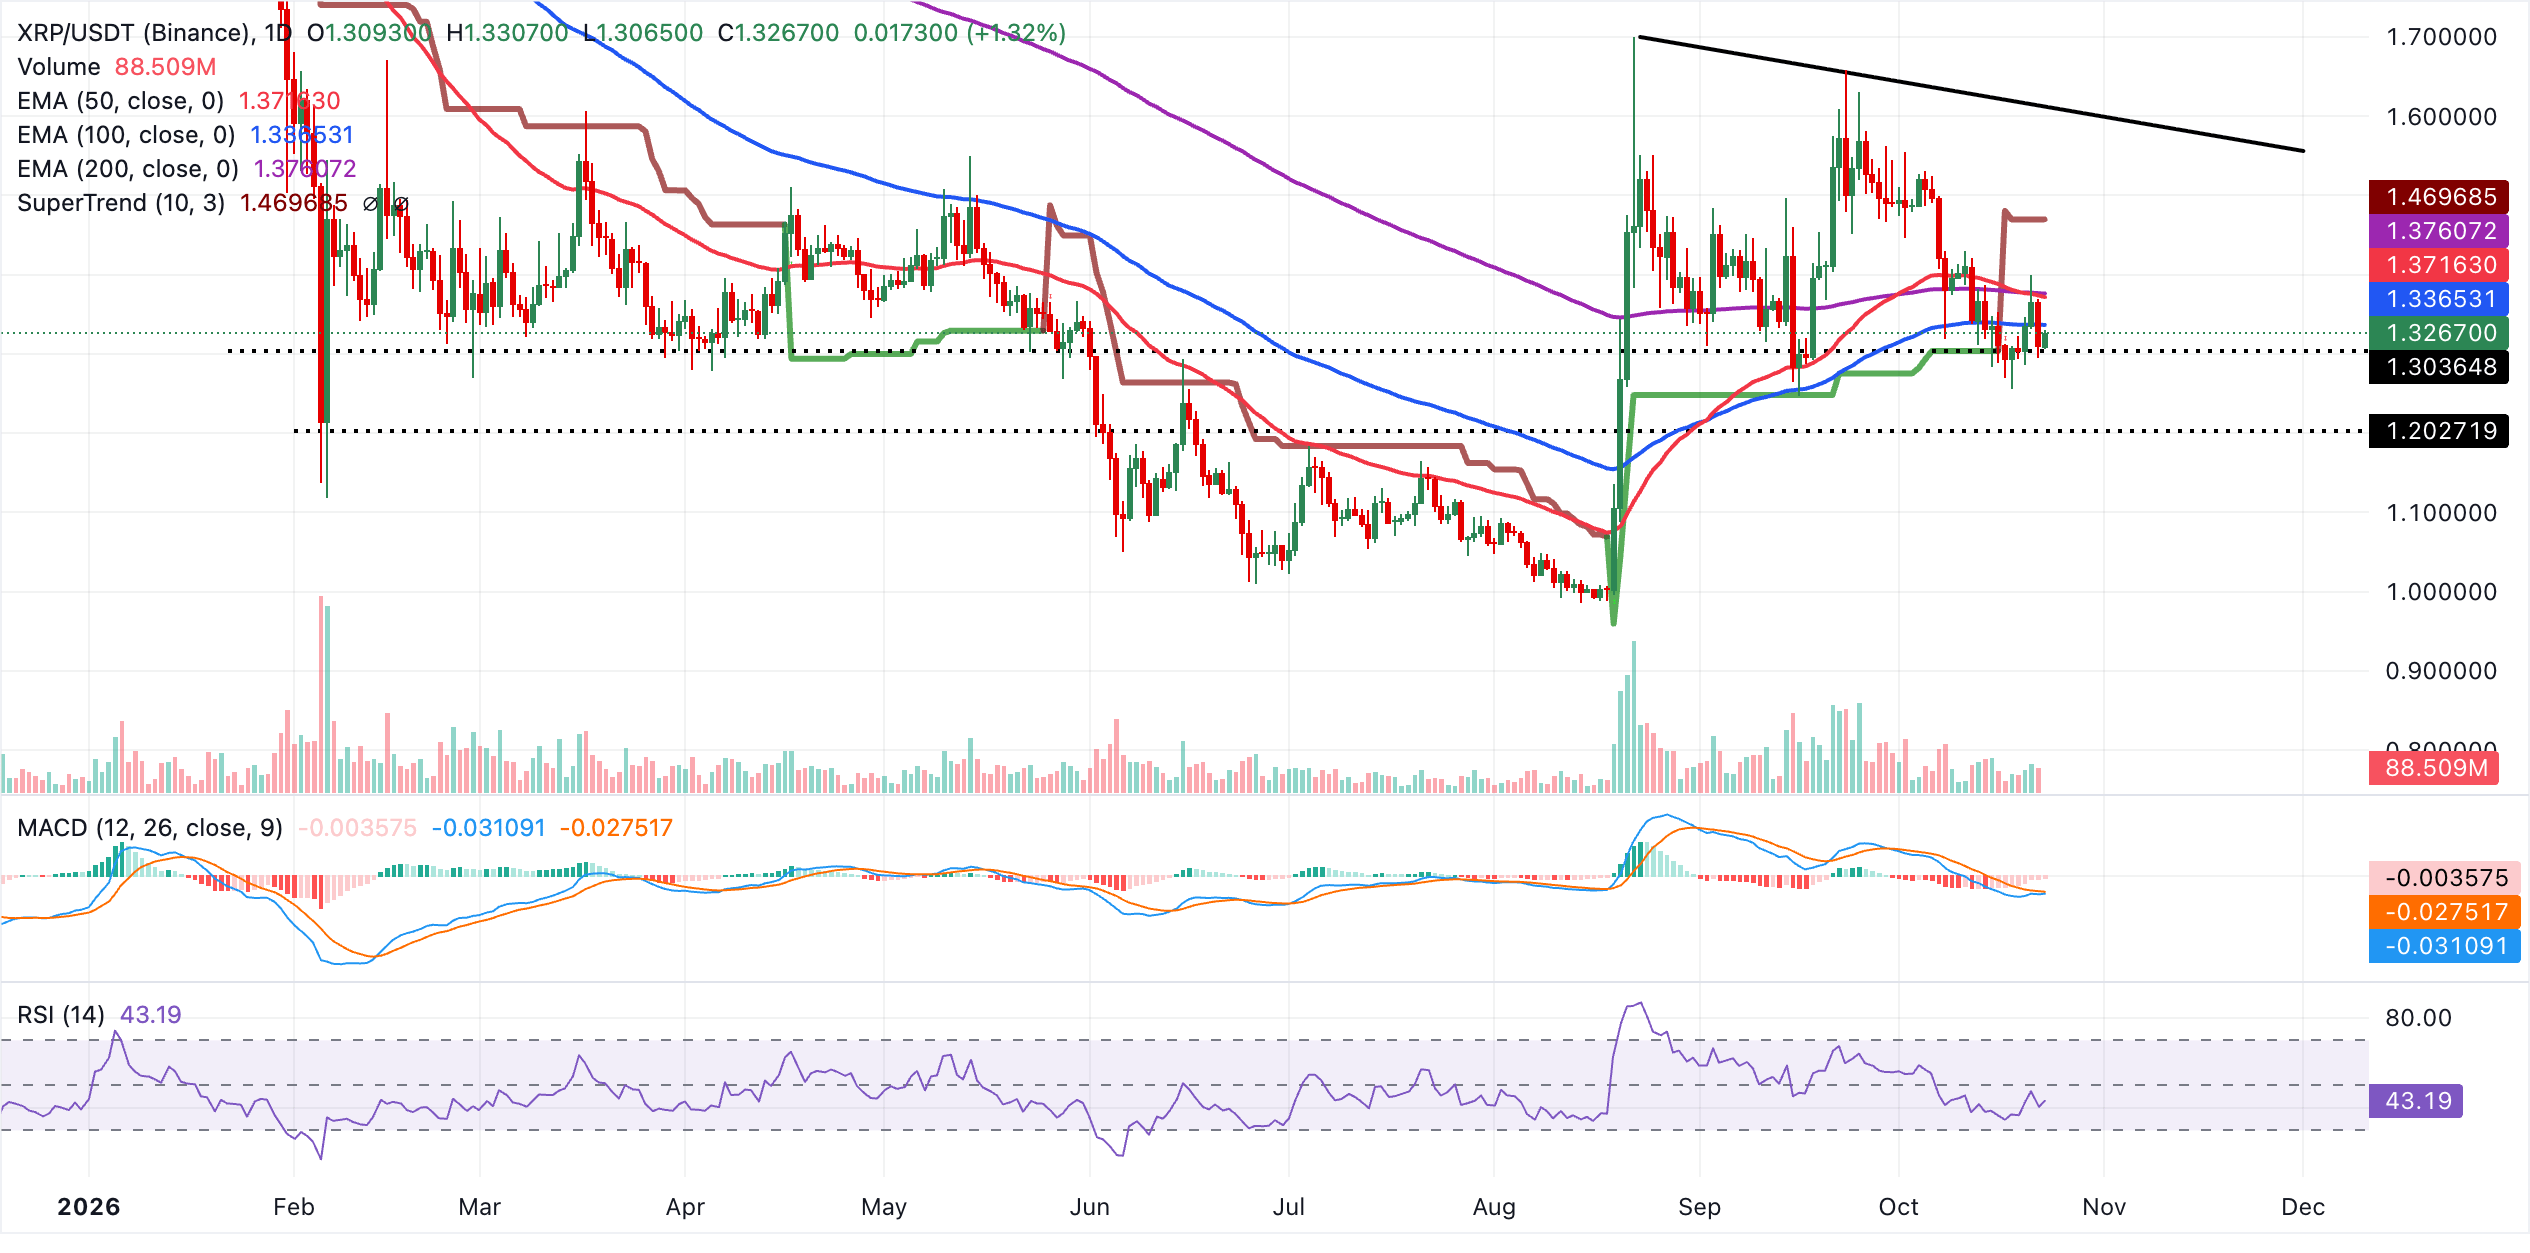
To relieve immediate selling pressure, XRP would need a sustained close above its first resistance level, the 100-day EMA at $1.34. Beyond that, the 50-day EMA at $1.37 and 200-day EMA at $1.38 create a concentrated supply zone. Only a decisive break through that band would indicate a more lasting recovery. Further out, the SuperTrend level at $1.47 remains a significant medium-term obstacle.
The daily chart offers no nearby moving-average or trendline support. As a result, weakening momentum would leave the pair vulnerable to another round of selling.
(The technical analysis of this story was written with the help of an AI tool. Know more.)
Crypto ETFs: Key Questions
By tracking the price of an underlying asset, an Exchange-Traded Fund (ETF), an investment vehicle or index, gives investors exposure to that asset. Its scope can extend beyond a single holding to a collection of assets and sectors. A Bitcoin ETF, for instance, follows Bitcoin’s price. Investors use ETFs to obtain exposure to a particular asset.
Bitcoin futures ETFs have received approval. In October 2021, the first US Bitcoin futures ETF was authorised by the US Securities & Exchange Commission. Seven Bitcoin futures ETFs have been approved in total, while more than 20 await regulatory permission. Describing the cryptocurrency industry as new and vulnerable to manipulation, the SEC cites these concerns as the reason it has delayed crypto-related futures ETFs over the past few years.
They have. In January 2024, several Bitcoin spot Exchange-Traded Funds received SEC approval for listing and trading. This enabled institutional capital and mainstream investors to trade the leading cryptocurrency through these funds. The industry welcomed the decision as a game changer.
Exposure without ownership is the principal benefit of crypto ETFs, reducing the risks and costs of holding cryptocurrency directly. They also require less learning and offer investors greater security, as the funds take responsibility for safeguarding the underlying assets. The central drawback is the lack of direct ownership. In crypto terminology, “not your keys, not your coins.” Fees for active management are another disadvantage, adding to the costs associated with holding crypto. Although an ETF lowers the risks involved in holding the asset, fluctuations in the underlying cryptocurrency’s price are still likely to feed through to the investment vehicle.
POPULAR ARTICLES
1US Dollar: AI pressures cast doubt on safe-haven status – ING2$4,000: Gold battles to defend support after steep sell-off3Brent prices rise amid geopolitical tensions - Commerzbank4Australian Dollar: Gains Against US Dollar Capped by Consolidation – UOB5Australian Dollar gains modestly against US Dollar before US flash PMI release6BTC extends losses: Bitcoin Weekly Forecast weighs ETF inflows against risk-off sentiment750-day EMA: Bitcoin holds support while Ethereum and XRP encounter structural resistance | Crypto Today8British Pound lags despite strong UK flash PMI data9$4,000 area: XAU/USD rebounds but bears retain control | Gold Price Forecast
LIVE QUOTES

ALL ABOUT TECHNICAL
What Is the Dark Cloud Cover Pattern and How Do You Trade It?
What Is the Piercing Line Candlestick Pattern and How Do You Trade It?
What Are Tweezer Top and Bottom Candlestick Patterns?
Inside Bar Candlestick Pattern: What It Is, How to Identify It, and How to Trade It
Hanging Man Candlestick Pattern: How to Identify and Trade It
How to Draw Fibonacci Retracement: Mastering the Golden Ratio in Trading
What is the Relative Strength Index (RSI)
What is Scalping in Trading & How Does It Work
Get Started!
Sign up and access the Global Markets in less than 3 minutes

Connect With Us









Contacts
Phone: +61 2 8036 8388
Fax: +61 2 8036 8388
Email: support@tmgm.com



The information provided on this website is of a general nature only and does not constitute personal financial advice. Before acting on any information on this website, you should consider the suitability of the information in relation to your objectives, financial situation and needs. Investing in CFDs and FX Margin Contracts carries significant risks and is not suitable for all investors. You may lose more than your initial deposit. You do not own, or have, any interest in the underlying asset. We recommend that you seek independent advice and ensure you fully understand the risks involved before trading. It is important that you read and consider the disclosure document before you acquire any product listed on the website. The information and advertisements offered on this website are not intended for use by any person in any country or jurisdiction where such use would be contrary to local laws and regulations. The Products and Services offered on this website are not intended for residents of the United States, Malaysia and Thailand.
TMGM is authorized and regulated in various jurisdictions.
Trademax Australia Limited, trading as TMGM, is regulated by the Australian Securities and Investments Commission (ASIC), AFSL no. 436416 and is located at Level 28, One International Tower, 100 Barangaroo Avenue, 2000 Sydney, NSW Australia.
Email: support@tmgm.com.au
Trademax Global Limited, trading as TMGM, is authorized and regulated by the Vanuatu Financial Services Commission (VFSC), registration number 40356 and registered at 1276, Kumul Highway, Port Vila, Vanuatu, Republic of Vanuatu.
Email: support@tmgm.com
Trademax Global Markets (SE) Limited, trading as TMGM, is authorized and regulated by the Financial Services Authority (FSA) of Seychelles, with license number SD224. The company is registered at Office No 13, Providence Estate ABIS Centre, Mahe, Seychelles.
Email: support@tmgm.com
Trademax Global Markets (International) Pty Ltd, trading as TMGM, is authorized and regulated by the Financial Services Commission, Mauritius (FSC) with license no. GB22201012, and registered at 33, Edith Cavell Street C/o IQ EQ Fund Services (Mauritius) Ltd Port Louis, 11324 Mauritius.
Email: support@tmgm.com
Copyright © TMGM. All rights reserved