

Trading
Explore a wide range of markets with competitive pricing, deep liquidity, and advanced trading tools.
Learn More 
Platform
Trade seamlessly with TMGM's powerful platform, built for speed, precision, and a superior trading experience.
Learn More Trading Platform
Academy
Learn the fundamentals of trading with beginner-friendly resources, including guides, webinars, and market insights.
Learn More News & Analysis
Get real-time market updates and expert analysis to stay ahead of trading opportunities
Learn More News & Analysis
About
Learn what sets TMGM apart — our global presence, regulatory strength, and commitment to innovation in trading.
Learn More Why Choose TMGM
Sponsorship
Starknet Price Forecast: STRK rally tests key breakout amid proposed Layer-1 transition
- Starknet is up 16% so far on Friday, advancing the 13% rally from the previous day.
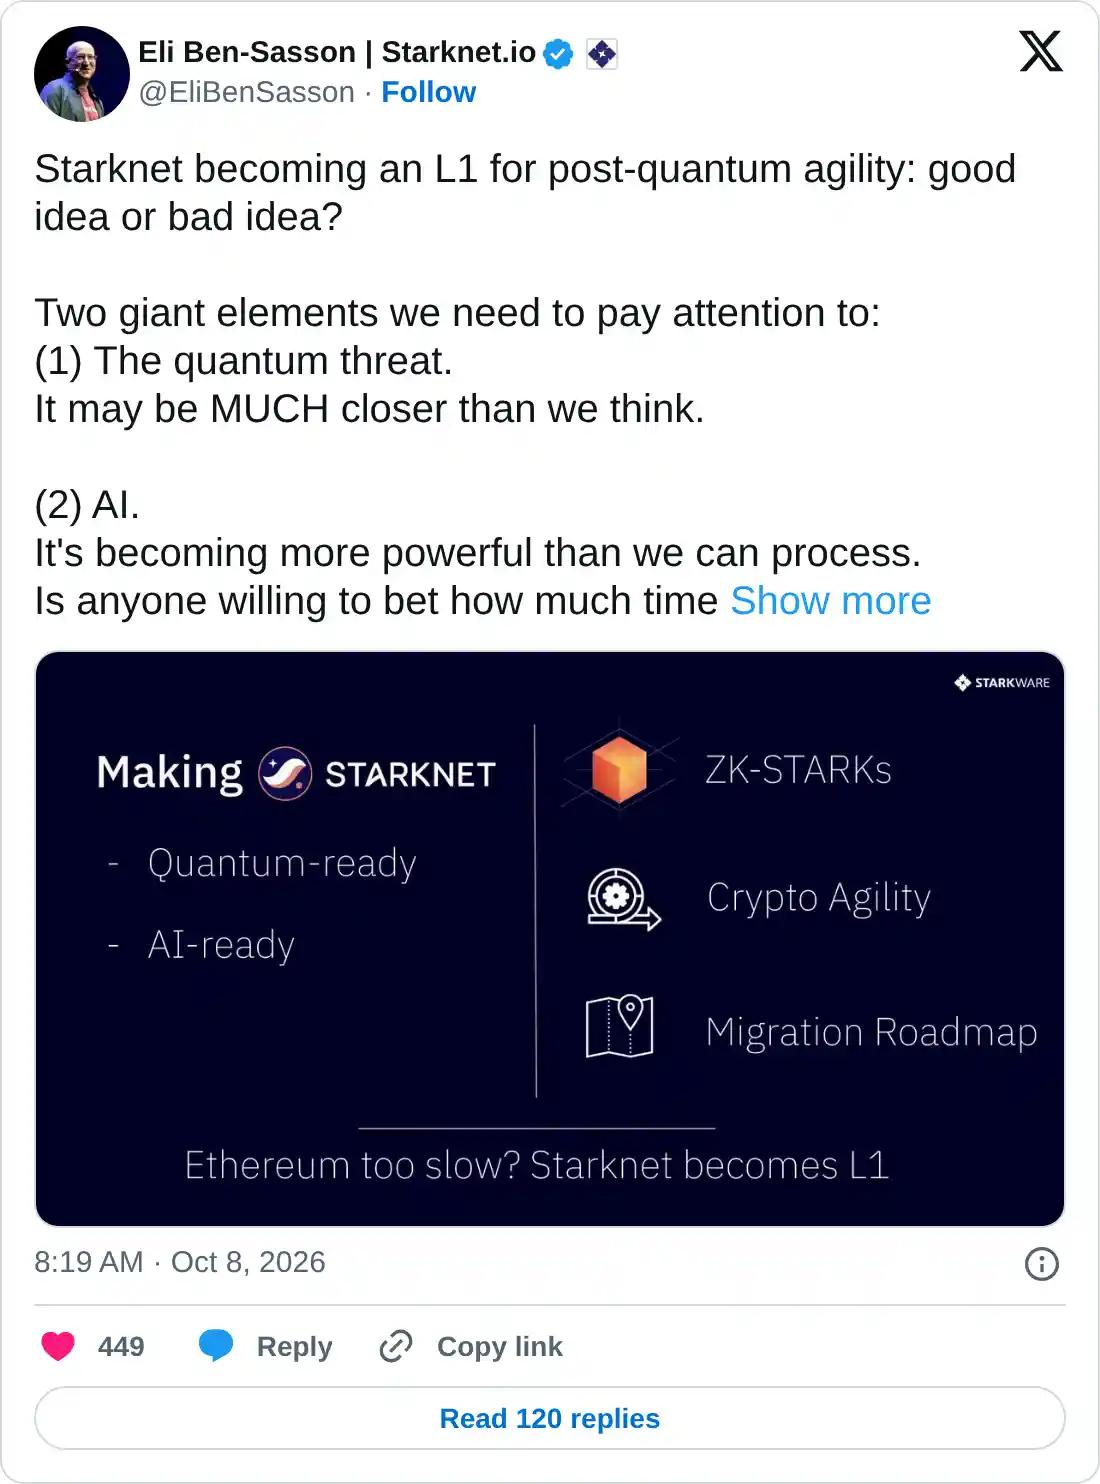
- Eli Ben-Sasson, CEO of StarkWare, proposed transitioning Starknet to Layer-1 to achieve quantum security by 2027.
- The technical outlook for STRK is bullish, with bulls focused on breaking above the eight-month-long resistance level near $0.05940.
Starknet (STRK) is up 16% so far on Friday, advancing its steady recovery of nearly 200% since mid-August. The rally aligns with the rising demand for financial anonymity in the cryptocurrency market and the CEO of StarkWare, Eli Ben-Sasson’s proposed transition of Starknet to Layer-1 to achieve quantum security by 2027. The technical outlook for STRK is bullish, suggesting upside potential toward the $0.1000 psychological milestone.

Starknet poised for Layer-1 transition to achieve quantum safety
Eli Ben-Sasson, CEO of StarkWare, the parent company of the decentralized layer-2 protocol Starknet, proposed a potential upgrade to the Layer-1 network in a social media post on Thursday. This upgrade will transition Starknet from Ethereum’s network to its own and focus on achieving security from quantum-computing and AI-related threats.
Technical outlook: Starknet rally eyes $0.10 as bullish pressure mounts
Starknet trades at an eight-month high above $0.06400 at press time on Friday, extending a strong bullish phase from the August 18 low of $0.02222. The STRK token price holds well above the 50-, 100-, and 200-day Exponential Moving Averages (EMAs) at $0.03945, $0.03604, and $0.04127, respectively, hinting at a constructive underlying trend.
From a technical perspective, STRK's rally tests the bullish breakout above the February 3 high of $0.05970, which previously capped gains at the May 7 high of around $0.05944. A Fibonacci retracement from the May 7 high at $0.05944 to the August 22 low at $0.02222 highlights the 127.2% and 161.8% extension levels at $0.07768 and $0.10918, respectively, if price secures a bullish close above $0.06000.
Momentum on the daily chart warns of an overstretched rally, with the Relative Strength Index (RSI) around 72 in overbought territory, while the Moving Average Convergence Divergence (MACD) remains positive, holding above its signal line, suggesting firm bullish momentum.
On the downside, initial support is seen at the former swing area around the $0.05000 psychological threshold, reinforced by Wednesday's low around $0.04825. Any deeper pullback could expose the 200-day EMA at $0.04127.
(The technical analysis of this story was written with the help of an AI tool. Know more.)
POPULAR ARTICLES
1Swiss Franc remains on front foot as USD slips further amid softer bond yields2AUD/JPY Price Forecast: Strengthens above 110.00, but remains bearish below 100-day SMA3China set to resume fuel exports in October following brief suspension — Reuters4India Gold price today: Gold rises, according to FXStreet data5Netherlands, The Manufacturing Output (MoM) increased to 3.3% in August from previous 1.6%6EUR/USD Price Forecast: Holds gains near 1.1230 on softer USD; bearish bias persists7EUR/JPY Price Forecast: Tests 177.50 barrier near nine-day EMA8Starknet Price Forecast: STRK rally tests key breakout amid proposed Layer-1 transition9Gold advances to weekly high amid modest USD weakness; not out of the woods yet
LIVE QUOTES


ALL ABOUT TECHNICAL
What Is the Dark Cloud Cover Pattern and How Do You Trade It?
What Is the Piercing Line Candlestick Pattern and How Do You Trade It?
What Are Tweezer Top and Bottom Candlestick Patterns?
Inside Bar Candlestick Pattern: What It Is, How to Identify It, and How to Trade It
Hanging Man Candlestick Pattern: How to Identify and Trade It
How to Draw Fibonacci Retracement: Mastering the Golden Ratio in Trading
What is MACD & How to Identify Entry & Exit Points
What is the Relative Strength Index (RSI)
What is Scalping in Trading & How Does It Work
Get Started!
Sign up and access the Global Markets in less than 3 minutes

Connect With Us









Contacts
Phone: +61 2 8036 8388
Fax: +61 2 8036 8388
Email: support@tmgm.com



The information provided on this website is of a general nature only and does not constitute personal financial advice. Before acting on any information on this website, you should consider the suitability of the information in relation to your objectives, financial situation and needs. Investing in CFDs and FX Margin Contracts carries significant risks and is not suitable for all investors. You may lose more than your initial deposit. You do not own, or have, any interest in the underlying asset. We recommend that you seek independent advice and ensure you fully understand the risks involved before trading. It is important that you read and consider the disclosure document before you acquire any product listed on the website. The information and advertisements offered on this website are not intended for use by any person in any country or jurisdiction where such use would be contrary to local laws and regulations. The Products and Services offered on this website are not intended for residents of the United States, Malaysia and Thailand.
TMGM is authorized and regulated in various jurisdictions.
Trademax Australia Limited, trading as TMGM, is regulated by the Australian Securities and Investments Commission (ASIC), AFSL no. 436416 and is located at Level 28, One International Tower, 100 Barangaroo Avenue, 2000 Sydney, NSW Australia.
Email: support@tmgm.com.au
Trademax Global Limited, trading as TMGM, is authorized and regulated by the Vanuatu Financial Services Commission (VFSC), registration number 40356 and registered at 1276, Kumul Highway, Port Vila, Vanuatu, Republic of Vanuatu.
Email: support@tmgm.com
Trademax Global Markets (SE) Limited, trading as TMGM, is authorized and regulated by the Financial Services Authority (FSA) of Seychelles, with license number SD224. The company is registered at Office No 13, Providence Estate ABIS Centre, Mahe, Seychelles.
Email: support@tmgm.com
Trademax Global Markets (International) Pty Ltd, trading as TMGM, is authorized and regulated by the Financial Services Commission, Mauritius (FSC) with license no. GB22201012, and registered at 33, Edith Cavell Street C/o IQ EQ Fund Services (Mauritius) Ltd Port Louis, 11324 Mauritius.
Email: support@tmgm.com
Copyright © TMGM. All rights reserved