

Trading
Explora una amplia gama de mercados con precios competitivos, liquidez profunda y herramientas de trading avanzadas.
Más información 
Plataforma
Opera sin interrupciones con la potente plataforma de TMGM, diseñada para ofrecer velocidad, precisión y una experiencia de trading superior.
Más información Plataforma de trading
Herramientas de trading
Academia
Aprende los fundamentos del trading con recursos ideales para principiantes, incluidas guías, seminarios web y análisis del mercado.
Más información Academia TMGM
Noticias y análisis
Obtén actualizaciones del mercado en tiempo real y análisis de expertos para adelantarte a las oportunidades de trading
Más información Noticias y análisis
Acerca de
Descubre qué distingue a TMGM: nuestra presencia global, solidez regulatoria y compromiso con la innovación en el trading.
Más información Por qué elegir TMGM
Crypto Today: Bitcoin, Ethereum and XRP test short-term support amid market-wide selling
- Bitcoin faces increasing sell-side pressure as support near $80,000 holds amid capital outflows.
- Ethereum slides below $2,400 as a weakening technical structure and returning ETF outflows weigh on price action.
- XRP holds above the SuperTrend indicator dynamic support, but downtrending momentum indicators limit the recovery outlook.
Cryptocurrency prices remain under intense selling pressure on Thursday, with Bitcoin (BTC) struggling to hold above $81,000 after testing its key demand area near $80,000. Ethereum (ETH) reflects Bitcoin’s weakening technical outlook, edging lower below $2,400.

Ripple (XRP), similarly, is in bearish hands, weighed down by a deteriorating momentum indicator and broader crypto market risk-off sentiment.
Sticky inflation and ETF outflows exacerbate risk-off sentiment
Wednesday’s United States (US) Consumer Price Index (CPI) report highlighted elevated inflation in the United States (US) amid higher Oil and energy prices. Headline inflation rose to 3.7% annually in September, printing above forecasts of 3.6% and up from August’s 3.4%.
Core CPI, excluding volatile food and energy prices, rose to 2.6% in the same month, up from 2.4% in August. Monthly CPI accelerated to 0.6% in September, up from 0.4% in August, while core CPI maintained its steady pace, increasing by 0.3% for the second consecutive month.
“That does not automatically make this a bearish signal for Bitcoin. Much of the headline increase came from gasoline, and core inflation held at August’s monthly pace,” Markus Levin, Co-founder of XYO, said in an emailed commentary, adding, “So I say crypto’s next move will largely depend on how investors reassess the Fed’s path, Treasury yields, and broader appetite for risk.”
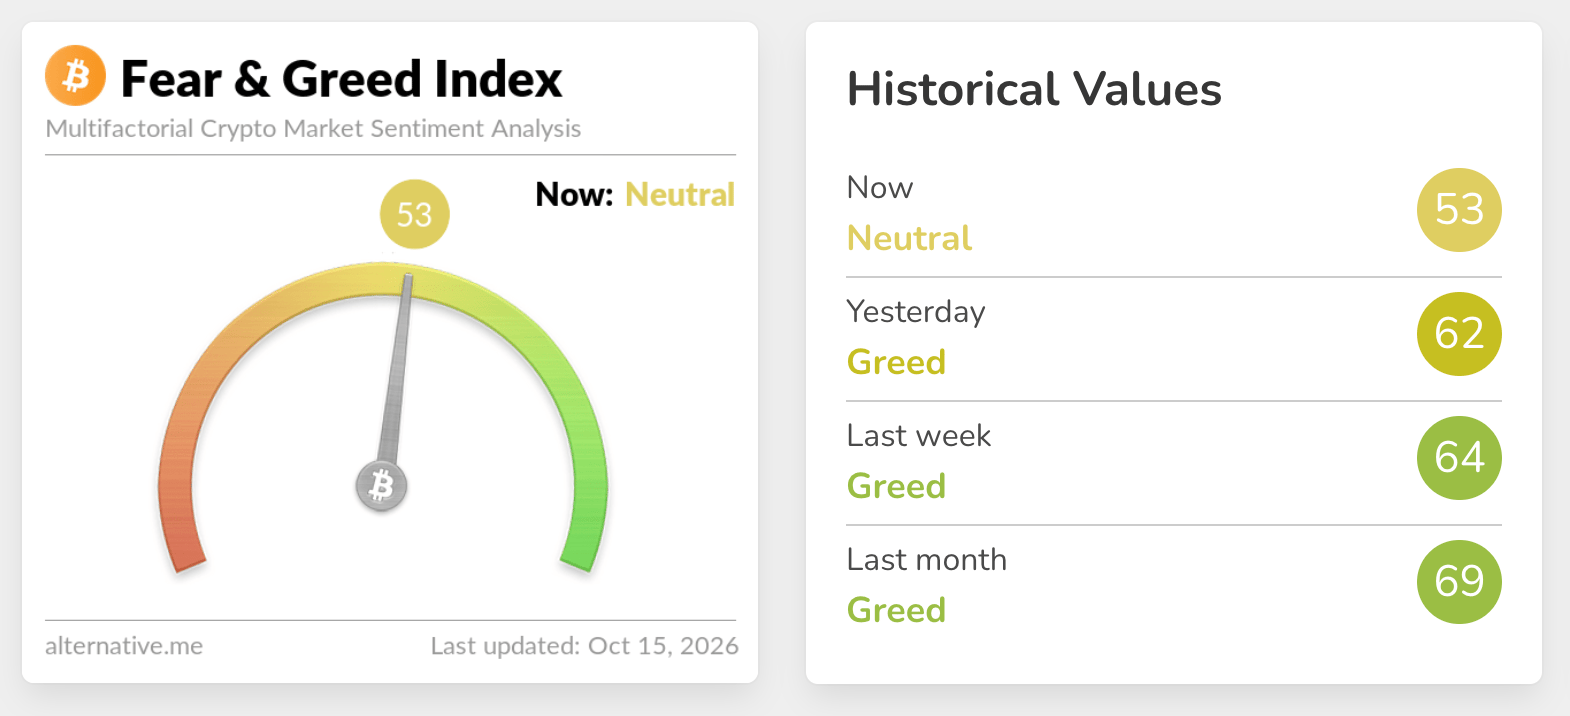
Nonetheless, the surprise uptick in inflation appears to have forced investors to reassess their positioning, as the crypto Fear & Greed Index fell to 53 on Thursday, from 62 the day before. This correction puts sentiment in Neutral territory after extended weeks in the Greed range.
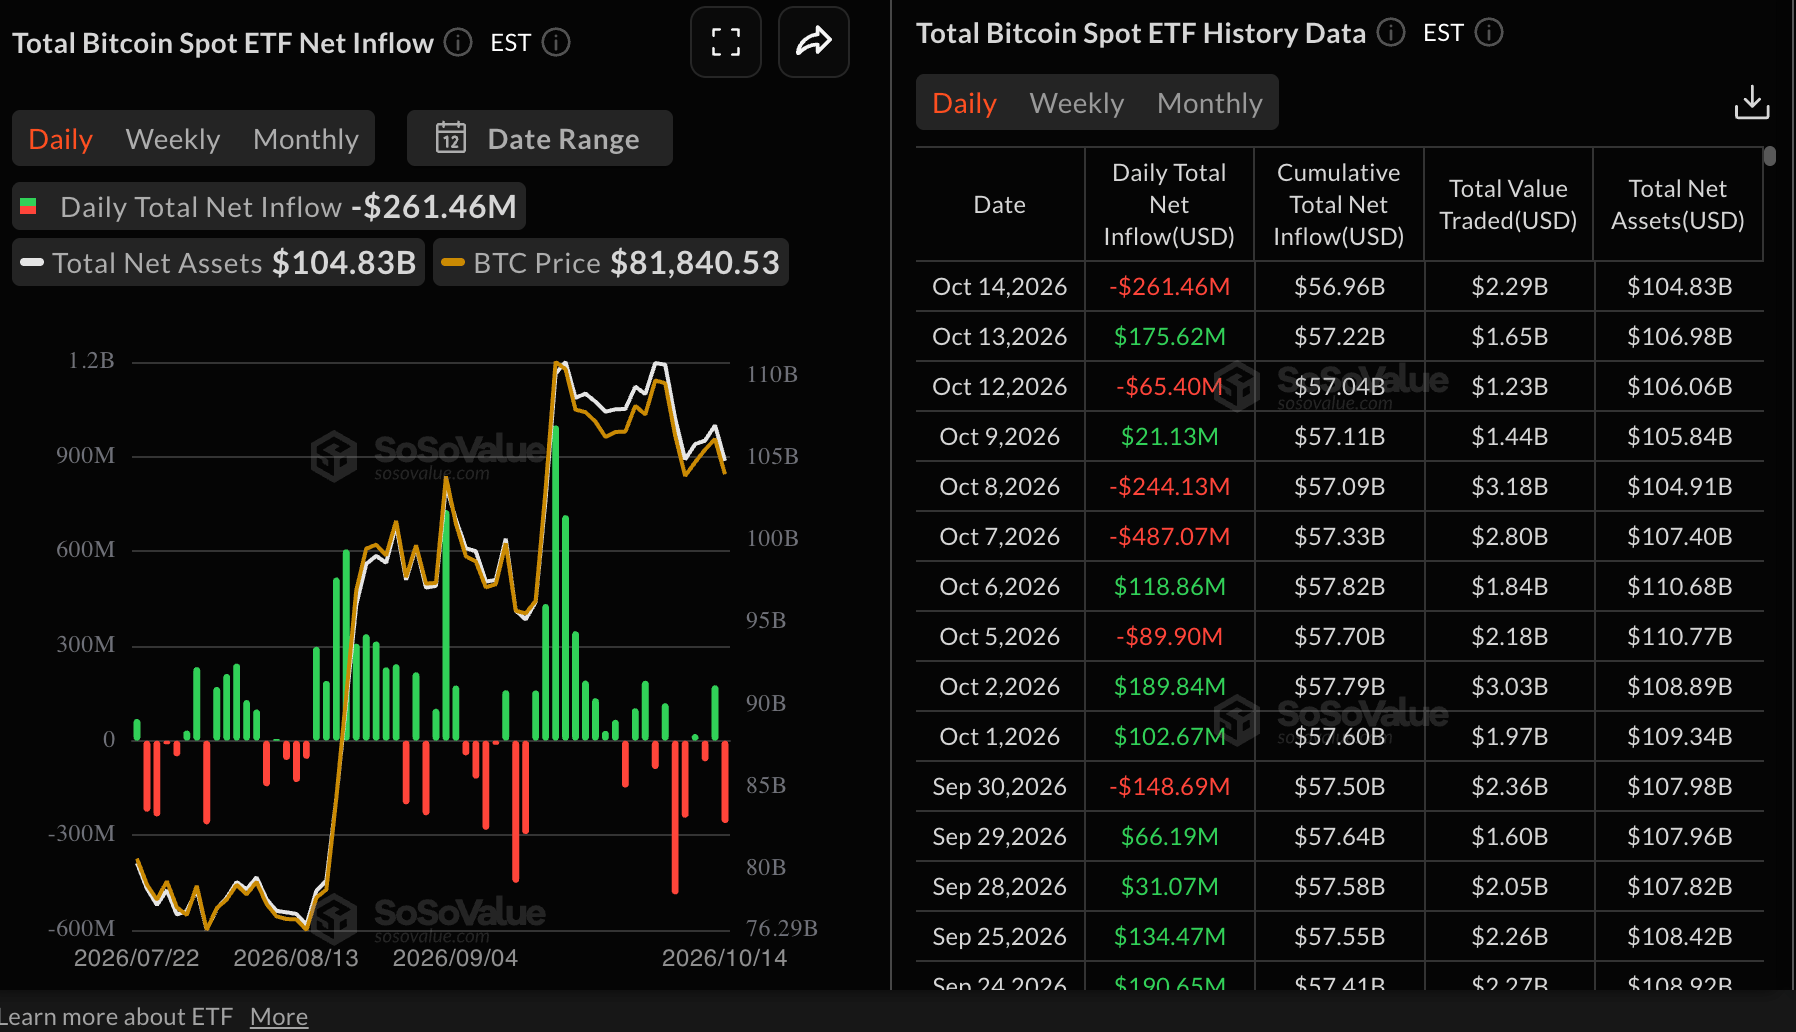
On the spot Exchange-Traded Funds (ETFs) front, BTC ETF outflows resumed, totaling $261 million on Wednesday after posting $176 million in inflows the previous day. These withdrawals alone cannot be used to confirm a full-fledged sell-off, but they warrant caution. Moreover, a sustained bearish streak could weigh on Bitcoin’s recovery outlook, increasing the odds of an extended correction below $80,000.
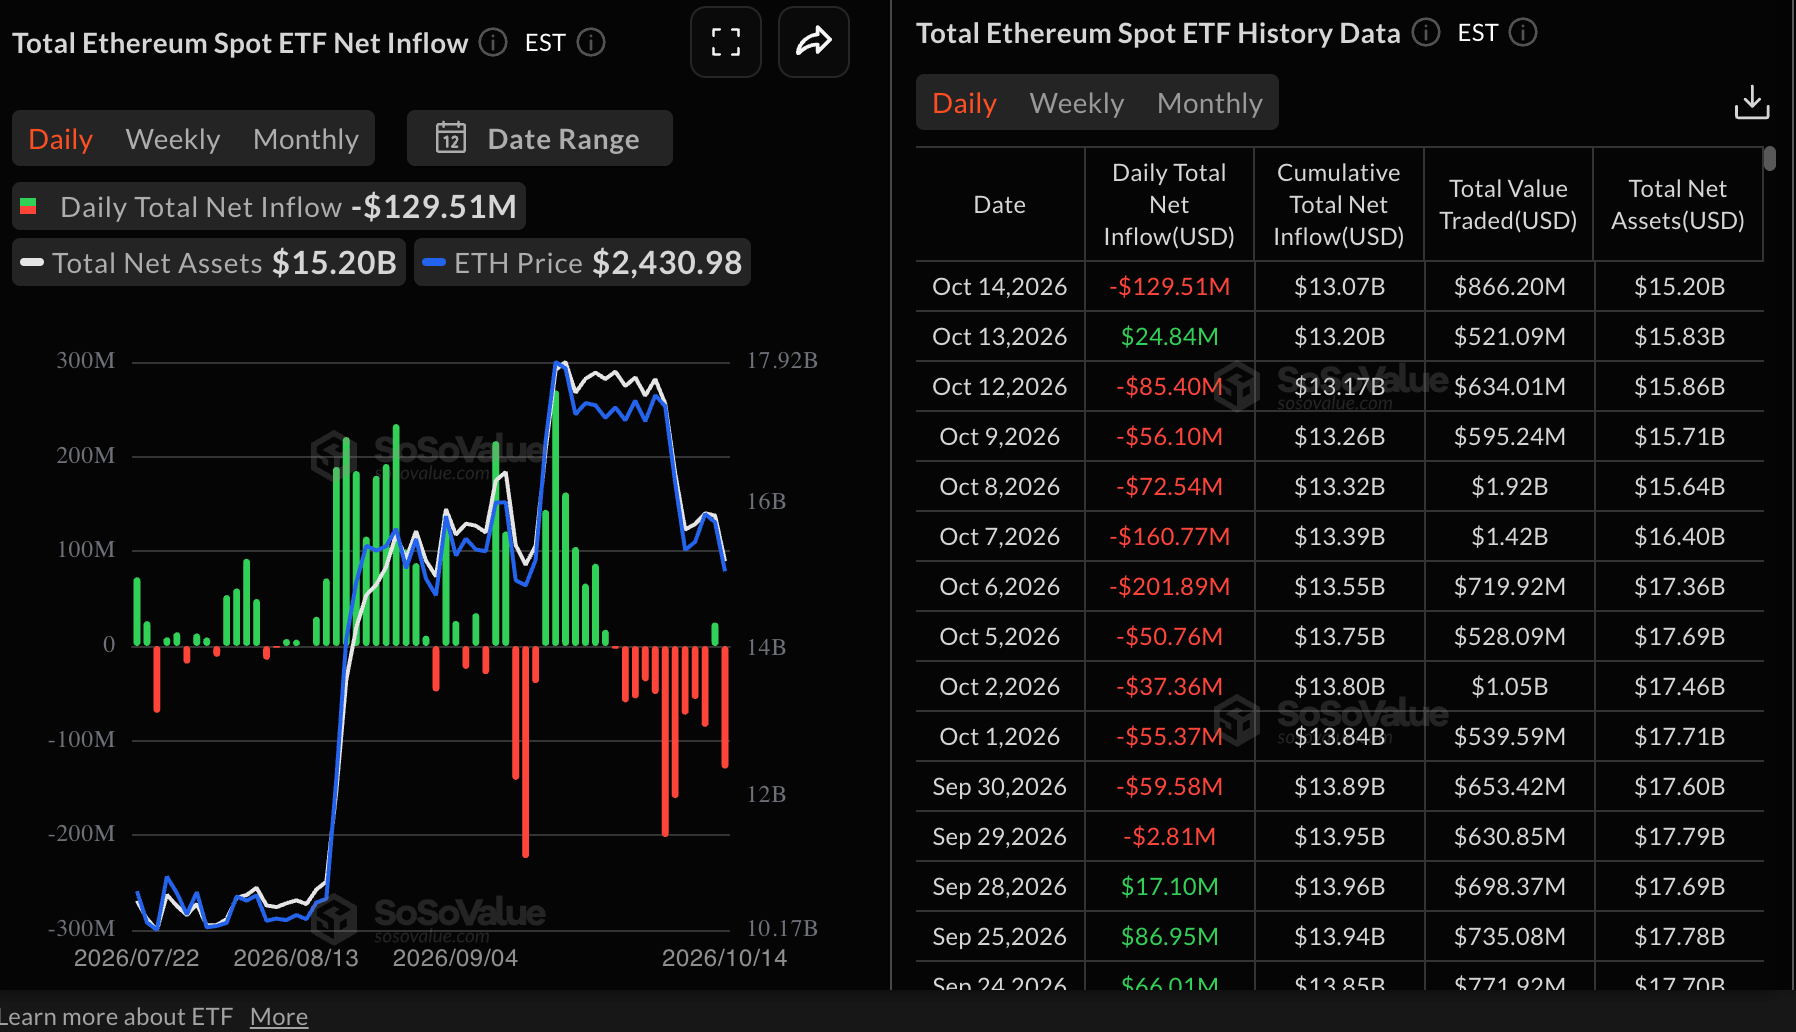
Ethereum spot ETFs also recorded outflows totaling $130 million on Wednesday, after logging $25 million in inflows the day before. Unlike Bitcoin, Tuesday’s inflows were an outlier, considering sustained outflows since September 29. Continued outflows will likely push Ethereum further down.
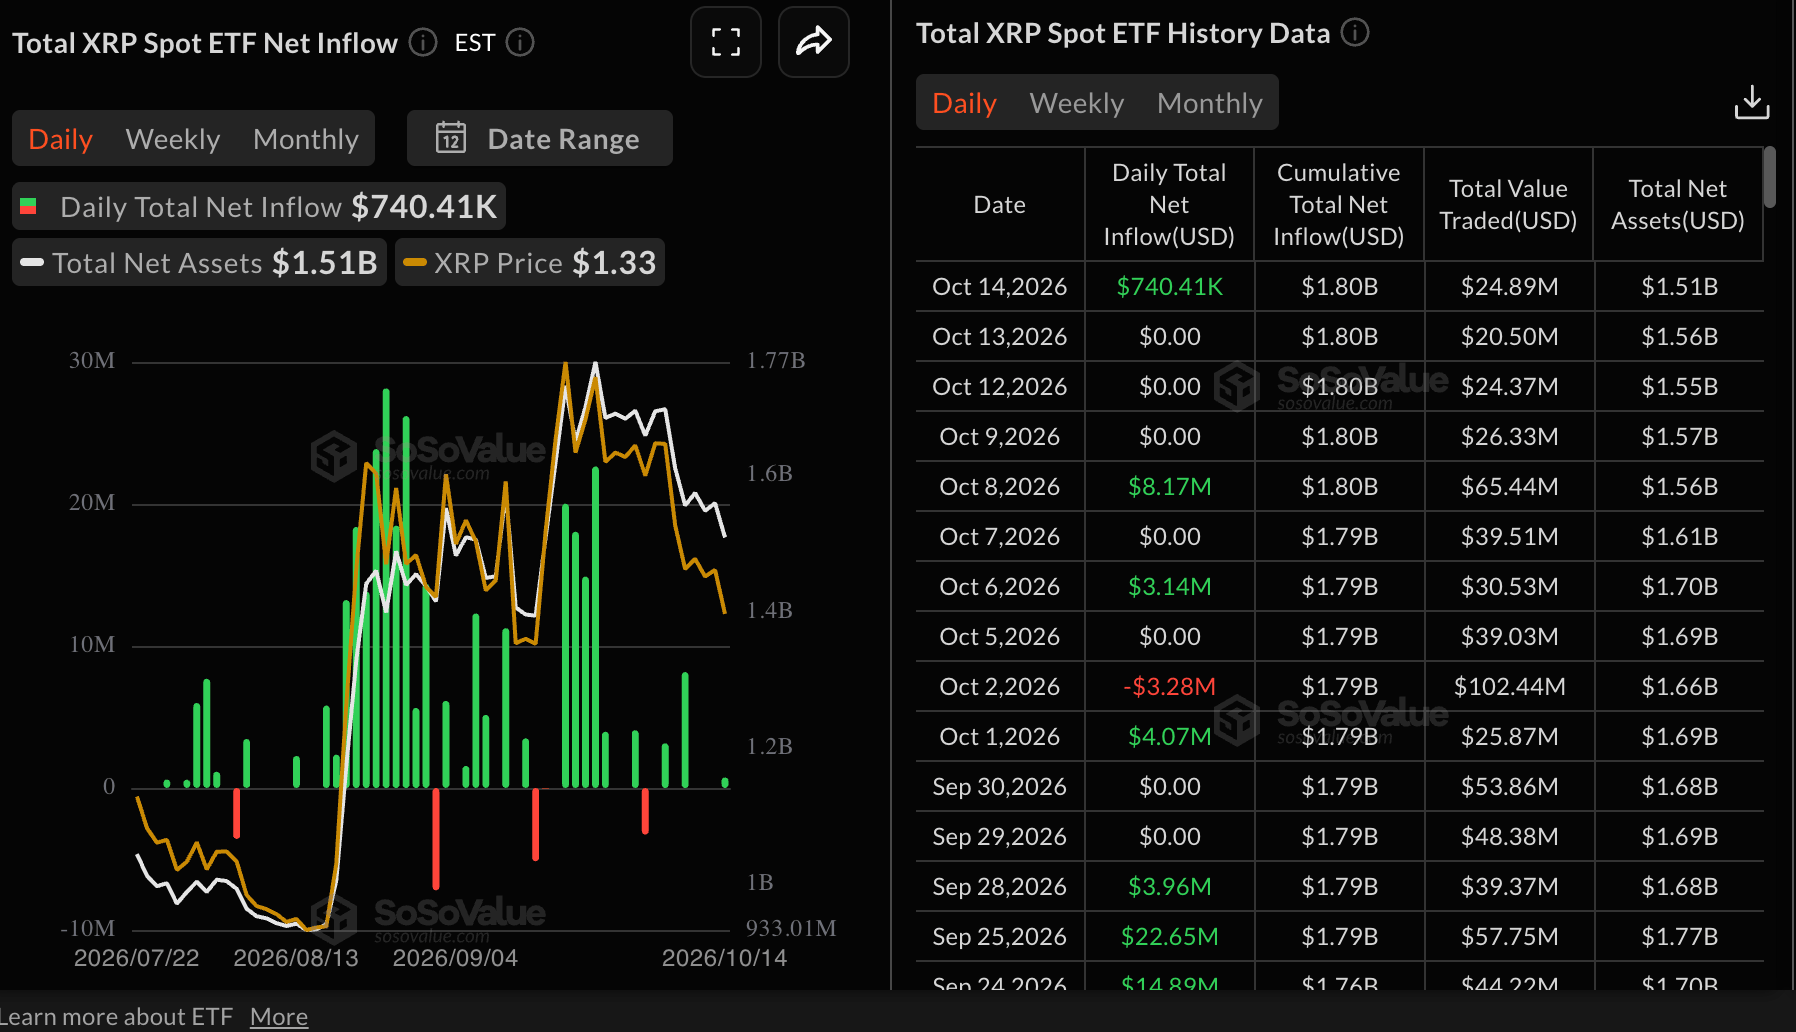
XRP spot ETFs presented a different picture from Bitcoin and Ethereum, recording very mild inflows of $740,000 on Wednesday. Looking back this week, XRP ETFs have shown muted activity since last Friday, undermining risk-on sentiment.
Technical analysis: Bitcoin wobbles as sell-side pressure intensifies
Bitcoin edges lower, trading near $81,000 while struggling to hold a constructive bullish bias. Despite the correction triggered amid inflation concerns, the spot price remains above the key Exponential Moving Averages (EMAs).
The 50-day EMA at $80,337, together with the 100-day EMA at $76,704 and the 200-day EMA at $75,908, all sit below the market and suggest that the broader uptrend is still supported despite the recent pullback. The SuperTrend line at $79,664 also underpins price action, while momentum readings are more cautious.
At the same time, the Moving Average Convergence Divergence (MACD) indicator is below zero, hinting at waning bullish pressure. The Relative Strength Index (RSI) at 45, just under neutral, confirms this configuration.
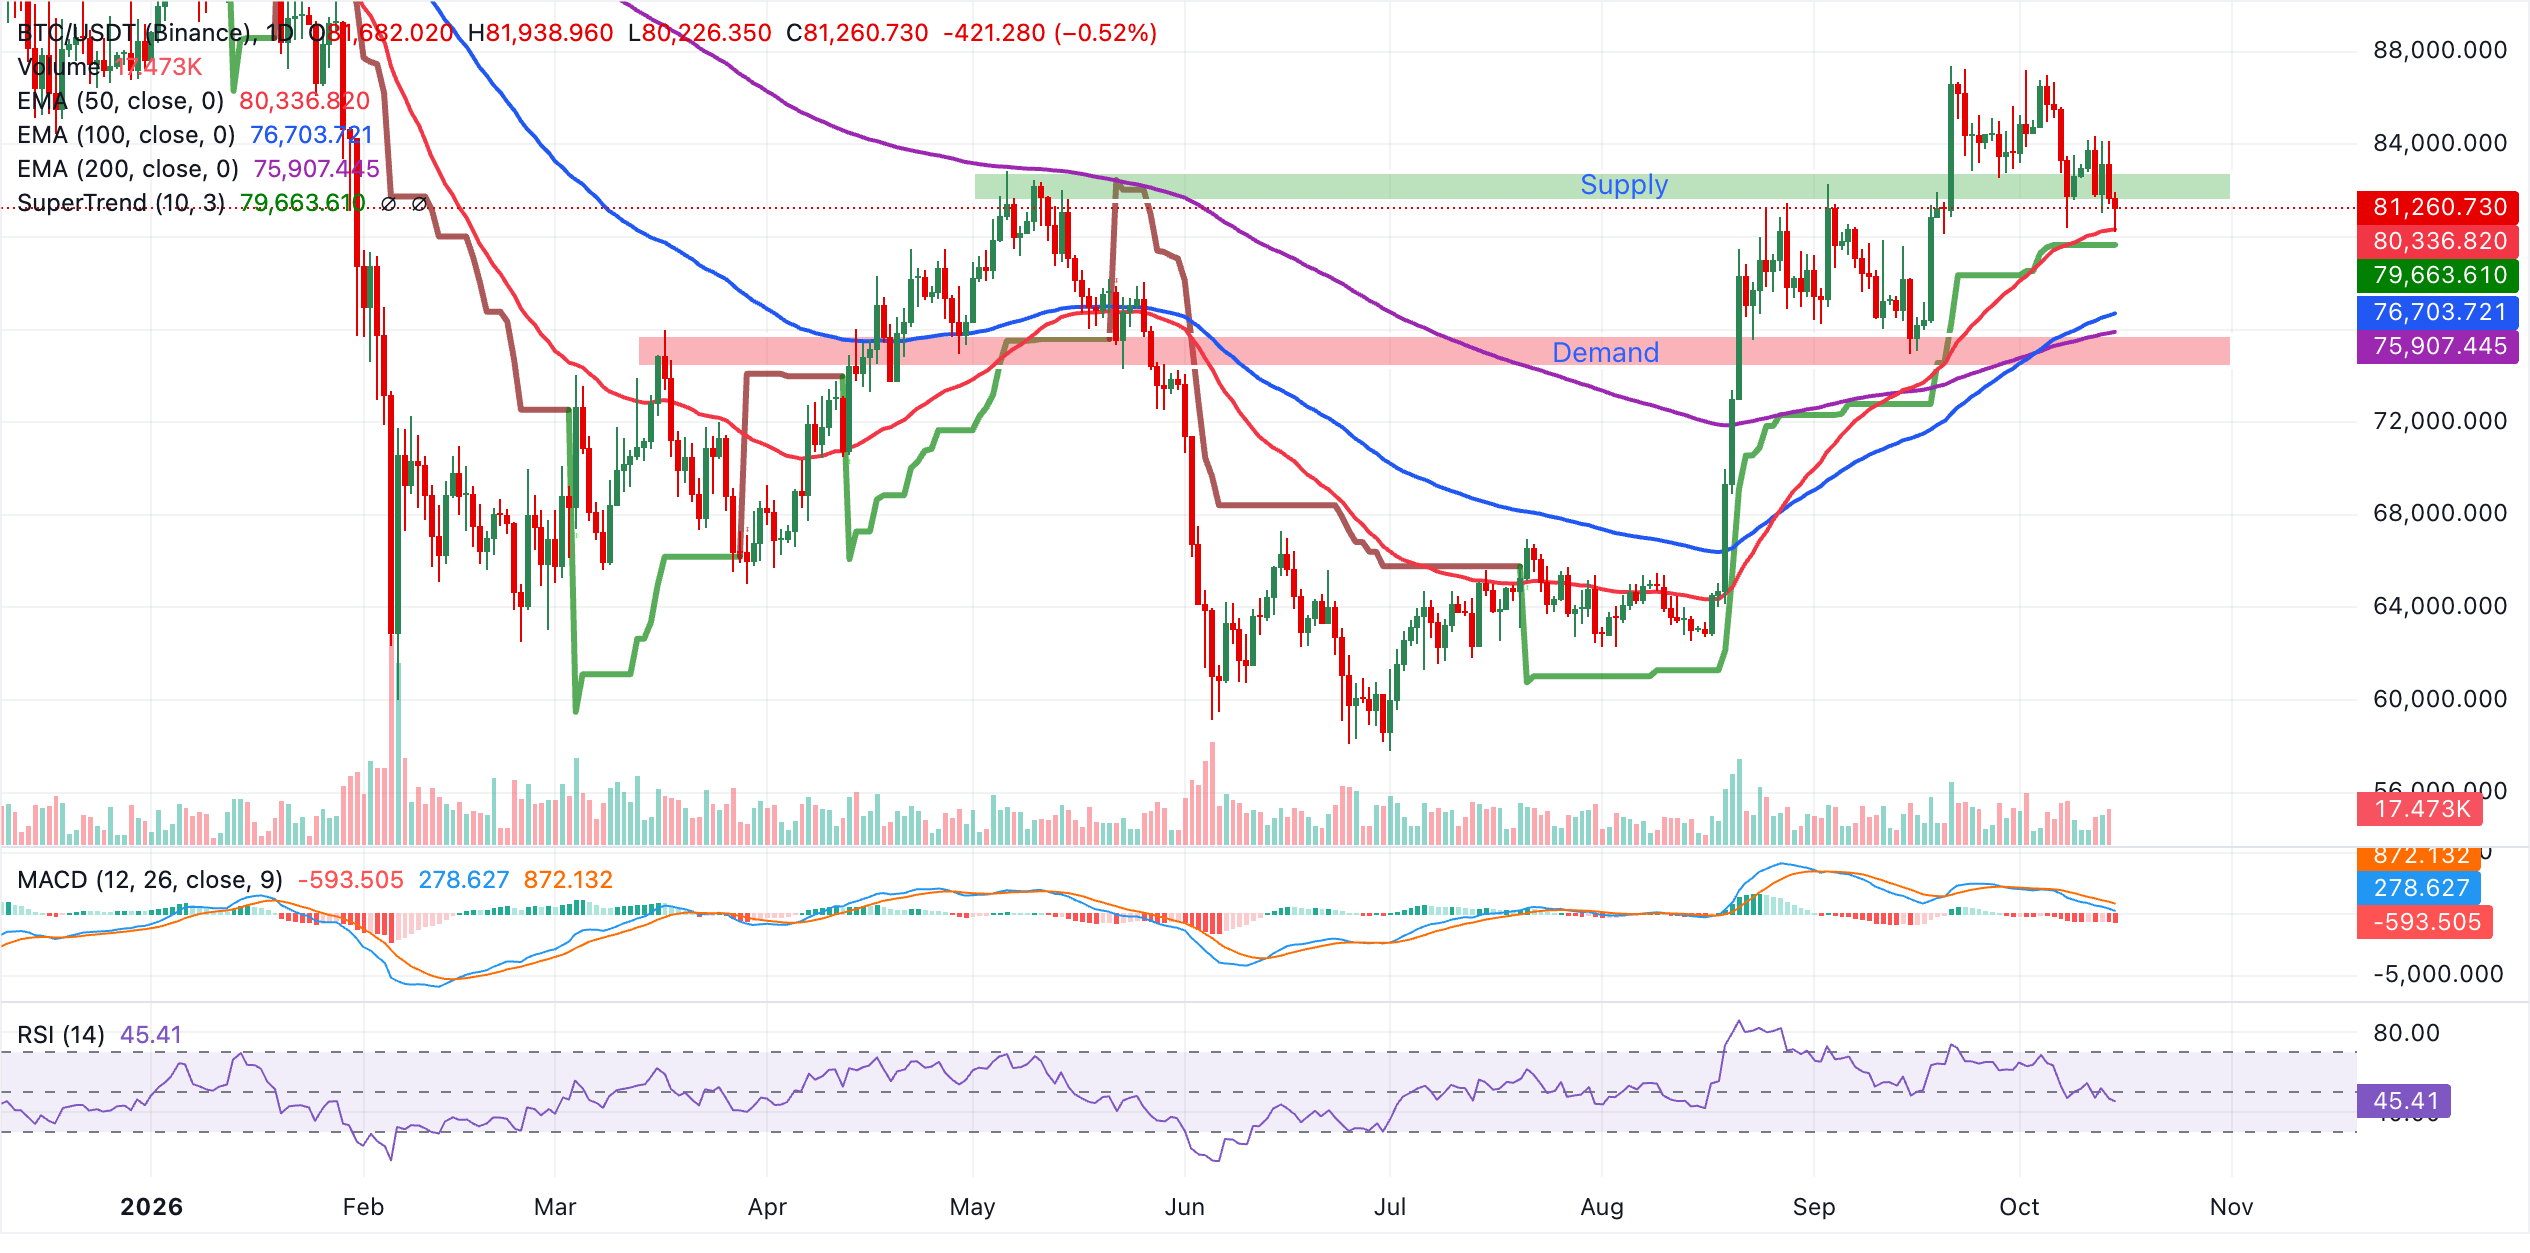
On the downside, the immediate support zone is clustered between the 50-day EMA at $80,337 and the SuperTrend baseline at $79,664, where buyers are likely to defend the recent breakout area. A deeper retreat would expose the 100-day EMA at $76,704, ahead of the more strategic 200-day EMA at $75,908, which reinforces the medium-term bullish structure as long as it holds.
With no clear overhead technical levels on the daily chart, near-term upside depends on whether price can breach key psychological levels at $84,000 and $87,000, or hold above this moving-average stack and eventually pull the MACD back toward positive territory, which would strengthen the bullish case.
Altcoins technical analysis: Ethereum and XRP risk deeper losses
Ethereum marks the second straight day of declines, trading below $2,400 as sell-side pressure deepens despite holding below the 50-day EMA at $2,493. This technical setup suggests a bearish near-term bias, with price capped by short-term trend resistance but cushioned by the medium- and long-term averages underneath.
The MACD indicator remains below zero with a negative reading and persistent weakness in the histogram, while the RSI has slipped toward the 35 area, hinting at sustained downside pressure but approaching oversold conditions.
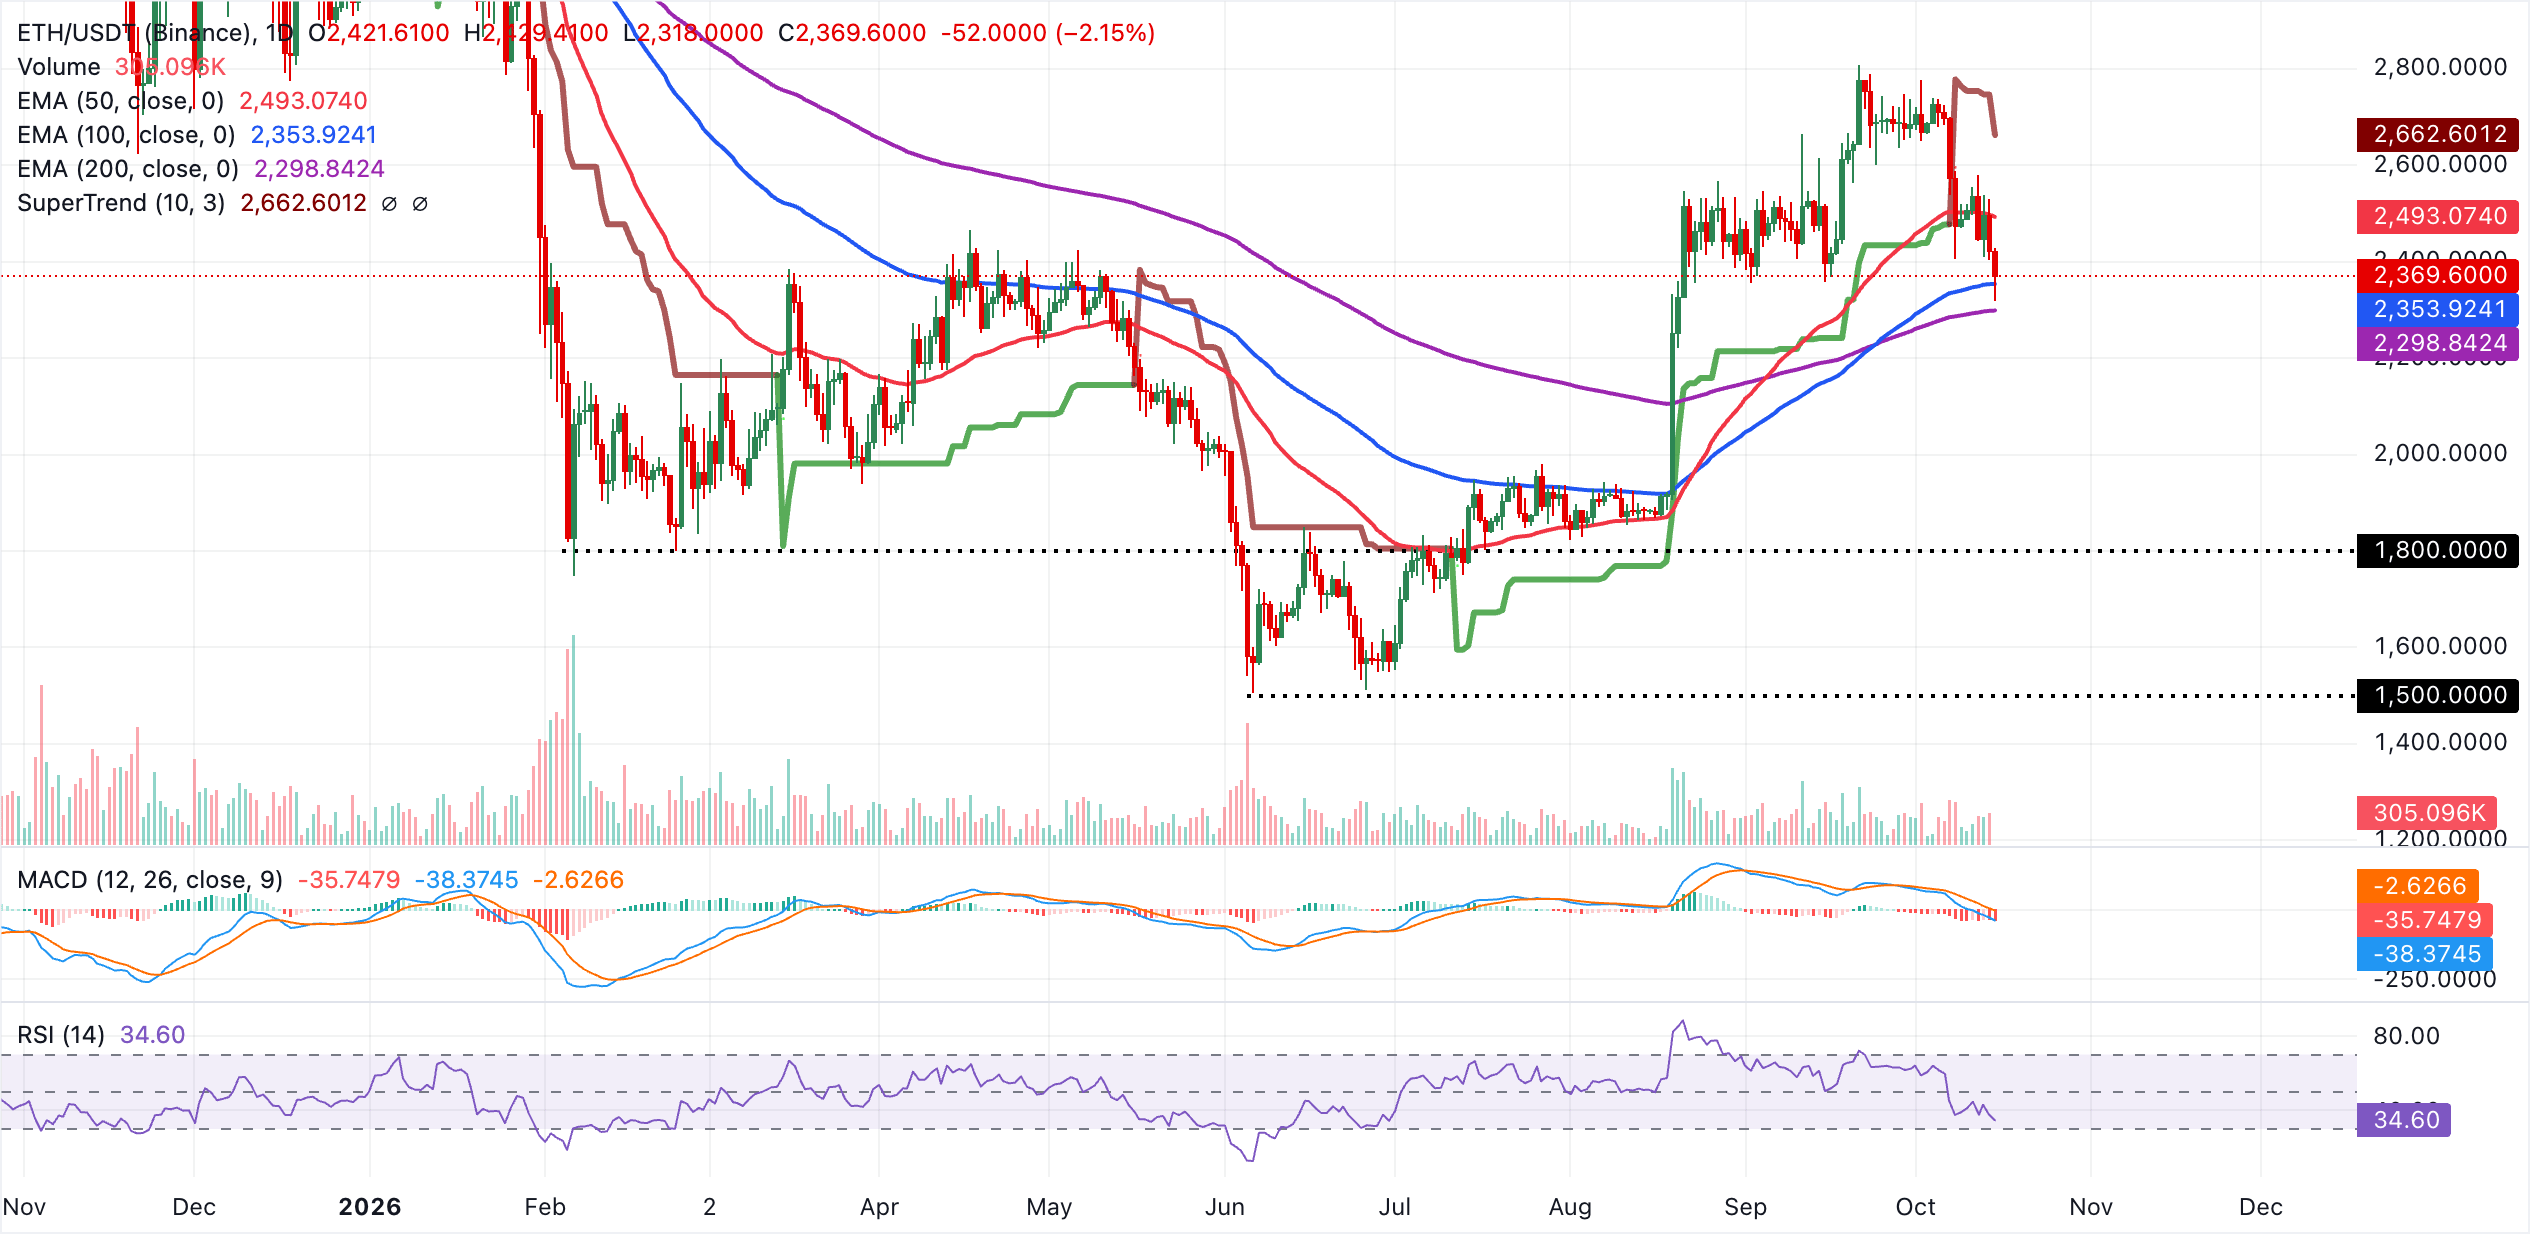
On the topside, initial resistance is seen at the 50-day EMA around $2,493, ahead of a stronger barrier defined by the SuperTrend line near $2,662, where selling interest could intensify if price attempts a rebound. On the downside, immediate support emerges at the 100-day EMA at $2,353, followed by a more solid structural floor at the 200-day EMA near $2,299. A daily close below this latter level would reinforce the bearish bias and expose deeper losses, while holding above it keeps scope for stabilization or a corrective bounce toward the $2,493 cap.
XRP, meanwhile, trades near $1.32, keeping a bearish near-term tone as price holds below the 100-day and 50-day EMAs at $1.34 and $1.39, as well as the 200-day EMA at $1.38. The MACD line remains below zero, while the RSI at 37 hovers just above oversold territory, suggesting persistent downside pressure even as sellers approach exhaustion.
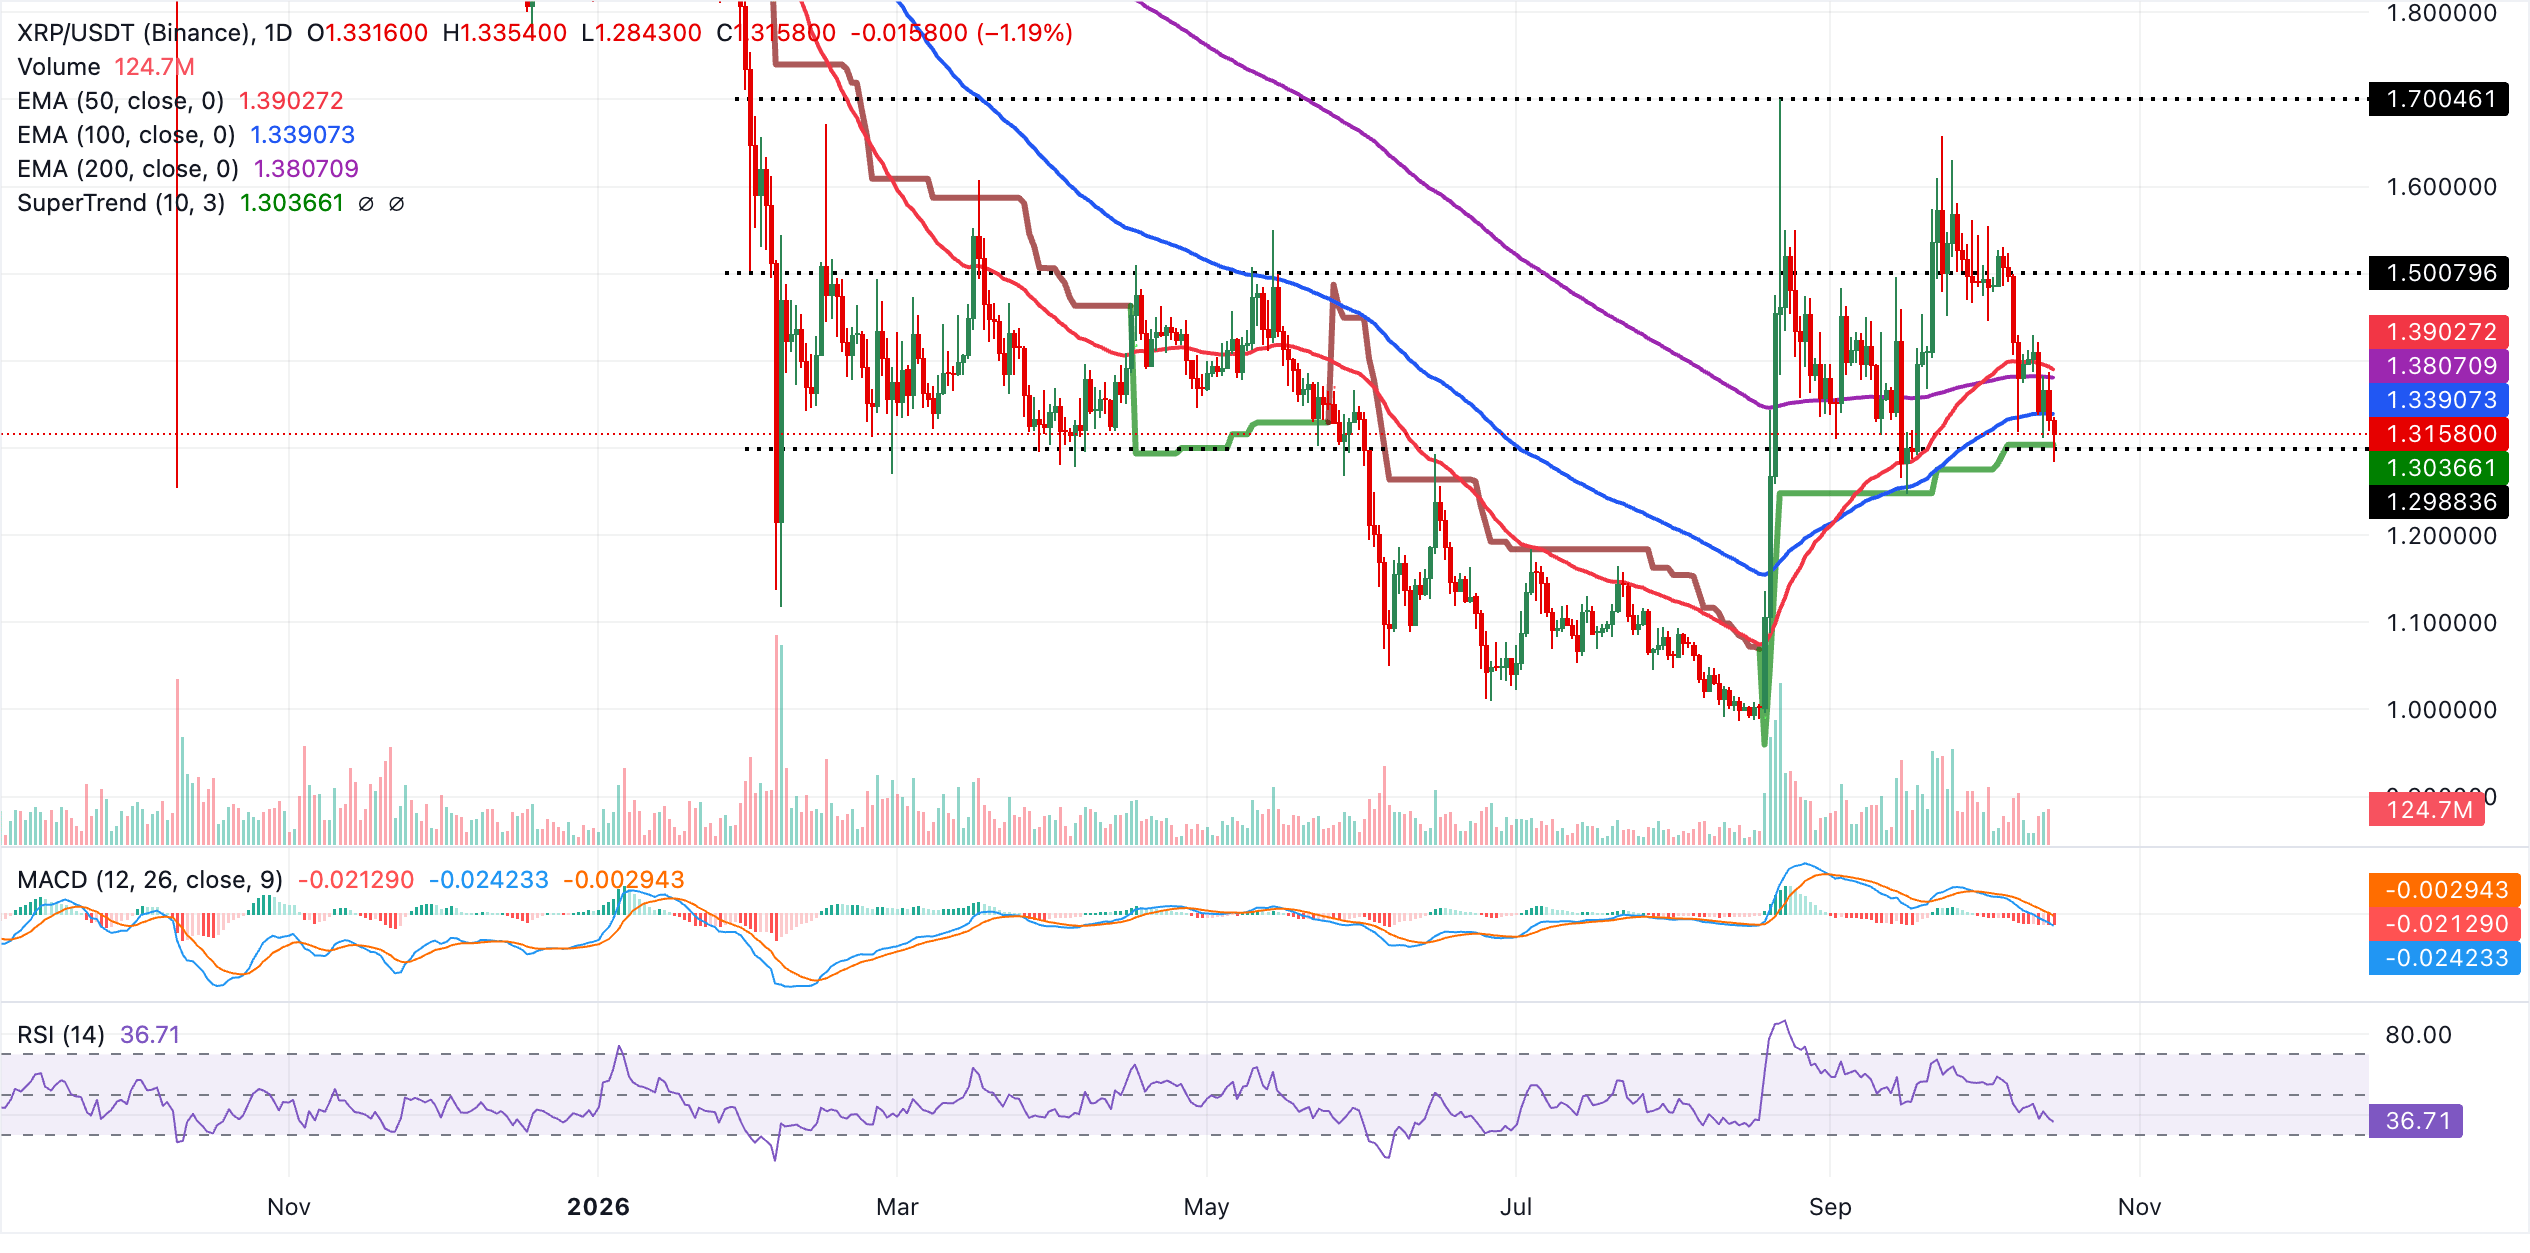
On the downside, immediate support lies at the SuperTrend line at $1.30, the first cushion against further declines. On the topside, initial resistance appears at the 100-day EMA at $1.34, followed by the 200-day EMA at $1.38 and the 50-day EMA near $1.39. The pair would need to reclaim these clustered moving-average barriers to shift the bias away from the current bearish configuration.
(The technical analysis of this story was written with the help of an AI tool. Know more.)
Crypto ETF FAQs
An Exchange-Traded Fund (ETF) is an investment vehicle or an index that tracks the price of an underlying asset. ETFs can not only track a single asset, but a group of assets and sectors. For example, a Bitcoin ETF tracks Bitcoin’s price. ETF is a tool used by investors to gain exposure to a certain asset.
Yes. The first Bitcoin futures ETF in the US was approved by the US Securities & Exchange Commission in October 2021. A total of seven Bitcoin futures ETFs have been approved, with more than 20 still waiting for the regulator’s permission. The SEC says that the cryptocurrency industry is new and subject to manipulation, which is why it has been delaying crypto-related futures ETFs for the last few years.
Yes. The SEC approved in January 2024 the listing and trading of several Bitcoin spot Exchange-Traded Funds, opening the door to institutional capital and mainstream investors to trade the main crypto currency. The decision was hailed by the industry as a game changer.
The main advantage of crypto ETFs is the possibility of gaining exposure to a cryptocurrency without ownership, reducing the risk and cost of holding the asset. Other pros are a lower learning curve and higher security for investors since ETFs take charge of securing the underlying asset holdings. As for the main drawbacks, the main one is that as an investor you can’t have direct ownership of the asset, or, as they say in crypto, “not your keys, not your coins.” Other disadvantages are higher costs associated with holding crypto since ETFs charge fees for active management. Finally, even though investing in ETFs reduces the risk of holding an asset, price swings in the underlying cryptocurrency are likely to be reflected in the investment vehicle too.
Artículos destacados
1GBP/USD Price Forecast: Pound pares losses and nears range top at 1.33002US Dollar: Inflation data keeps Fed risks alive – Rabobank3Brent: Risk premium holds as Persian Gulf flows rise – ING4Gold rebounds as global equity sell-off weigh on Treasury yields51.4195: Canadian Dollar tests range top amid lower US Yields, dovish Fedspeak6Crypto Today: Bitcoin, Ethereum and XRP test short-term support amid market-wide selling7US Dollar: AI-driven reversal after CPI gains – MUFG8Bitcoin Price Forecast: BTC slips below $81,000 amid inflation fears, ETF outflows9BoE to hike interest rates by 25 bps to 4% in November – Reuters poll
COTIZACIONES EN VIVO


TODO SOBRE TECHNICAL
Accumulation, Manipulation and Distribution (AMD): ICT Power of 3 Trading Guide
Backtesting in Trading: What It Is and How to Backtest a Strategy
RSI Divergence: Bullish, Bearish and Hidden Divergence Explained
What Is ICT Trading? Inner Circle Trader Concepts Explained
Support and Resistance: Meaning, Types, How to Draw Levels & Trading Strategies
What Is Liquidity? Meaning in Trading and Financial Markets
Liquidity Sweep: Meaning, Examples & Trading Strategy
Market Structure in Trading: The Complete Guide (Bullish, Bearish, Sideways)
Change of Character (CHoCH): Definition, Examples & Strategy
¡Comience ahora!
Regístrese y acceda a los mercados globales en menos de 3 minutos

Conéctese con nosotros









Contactos
Teléfono: +61 2 8036 8388
Fax: +61 2 8036 8388
Correo electrónico: support@tmgm.com



La información proporcionada en este sitio web es únicamente de carácter general y no constituye asesoramiento financiero personal. Antes de actuar sobre cualquier información de este sitio web, debe considerar la idoneidad de la información en relación con sus objetivos, situación financiera y necesidades. Invertir en CFD y contratos de margen de FX conlleva riesgos significativos y no es adecuado para todos los inversores. Puede perder más que su depósito inicial. Usted no posee ni tiene ningún interés en el activo subyacente. Le recomendamos que busque asesoramiento independiente y se asegure de comprender plenamente los riesgos involucrados antes de operar. Es importante que lea y considere el documento de divulgación antes de adquirir cualquier producto listado en el sitio web. La información y los anuncios ofrecidos en este sitio web no están destinados al uso por parte de ninguna persona en ningún país o jurisdicción donde dicho uso sea contrario a las leyes y regulaciones locales. Los productos y servicios ofrecidos en este sitio web no están destinados a residentes de Estados Unidos, Malasia y Tailandia.
TMGM está autorizado y regulado en varias jurisdicciones.
Trademax Australia Limited, que opera como TMGM, está regulada por la Comisión Australiana de Valores e Inversiones (ASIC), AFSL n.º 436416, y está ubicada en Level 28, One International Tower, 100 Barangaroo Avenue, 2000 Sydney, NSW Australia.
Correo electrónico: support@tmgm.com.au
Trademax Global Limited, que opera como TMGM, está autorizada y regulada por la Comisión de Servicios Financieros de Vanuatu (VFSC), número de registro 40356, y está registrada en 1276, Kumul Highway, Port Vila, Vanuatu, República de Vanuatu.
Correo electrónico: support@tmgm.com
Trademax Global Markets (SE) Limited, que opera como TMGM, está autorizada y regulada por la Autoridad de Servicios Financieros (FSA) de Seychelles, con número de licencia SD224. La empresa está registrada en Office No 13, Providence Estate ABIS Centre, Mahe, Seychelles.
Correo electrónico: support@tmgm.com
Trademax Global Markets (International) Pty Ltd, que opera como TMGM, está autorizada y regulada por la Comisión de Servicios Financieros de Mauricio (FSC) con licencia n.º GB22201012, y está registrada en 33, Edith Cavell Street C/o IQ EQ Fund Services (Mauritius) Ltd Port Louis, 11324 Mauricio.
Correo electrónico: support@tmgm.com
Copyright © TMGM. Todos los derechos reservados