

Trading
Explora una amplia gama de mercados con precios competitivos, liquidez profunda y herramientas de trading avanzadas.
Más información 
Plataforma
Opera sin interrupciones con la potente plataforma de TMGM, diseñada para ofrecer velocidad, precisión y una experiencia de trading superior.
Más información Plataforma de trading
Herramientas de trading
Academia
Aprende los fundamentos del trading con recursos ideales para principiantes, incluidas guías, seminarios web y análisis del mercado.
Más información Academia TMGM
Noticias y análisis
Obtén actualizaciones del mercado en tiempo real y análisis de expertos para adelantarte a las oportunidades de trading
Más información Noticias y análisis
Acerca de
Descubre qué distingue a TMGM: nuestra presencia global, solidez regulatoria y compromiso con la innovación en el trading.
Más información Por qué elegir TMGM
Ethereum Price Forecast: ETH falls below $2,500 as hot CPI raises Fed hike odds
Ethereum price today: $2,430
- Ethereum dropped below $2,500 after the US September CPI inflation reading came in hotter than expected.
- Selling pressure is evident across derivatives and spot markets, with rising liquidations and exchange inflows.
- ETH is facing pressure at the dense $2,548 and short-term EMAs' resistance zone.
Ethereum (ETH) extended its decline below $2,500 on Wednesday after a hotter-than-expected US inflation print renewed selling across the crypto market. At the time of writing, the top altcoin trades near $2,430, down 3.1% in the past 24 hours.

Hot inflation print pressures ETH as derivatives and spot markets show rising selling
The US Consumer Price Index (CPI) for September rose 0.6% monthly, in line with market forecasts and up from a 0.4% increase in August. However, annual headline inflation jumped to 3.7%, up from 3.4% and above expectations of 3.6%.
Core CPI, which excludes volatile energy and food prices, ticked upward to 0.3% monthly and 2.6% annually, both above forecasts of 0.2% and 2.5%.
Following the inflation reading, the US 10Y Treasury yields spiked to 5.32% before easing toward 5.22%.
The US Dollar Index (DXY), which measures the Greenback against a basket of six major currencies, also pushed above 102.80 for the first time since April 2025.
Additionally, odds of the Federal Reserve (Fed) raising interest rates at its October meeting increased from 22% to 35%, according to the CME FedWatch Tool.
Rising Treasury yields increase the opportunity costs of holding risk assets like cryptocurrencies. Also, a higher DXY affects crypto prices as they are predominantly valued in US Dollars, while rising interest rates dry up liquidity for riskier investments.
Ethereum dropped toward $2,430, down 3.1%, following the moves across these defensive tools. The decline resulted in $65.42 million in liquidations over the past 24 hours, with longs accounting for 83%, per Coinglass data. That marks a second straight day of rising long liquidations after the crypto's market whipsaw on Tuesday wiped off $120 million worth of ETH longs.
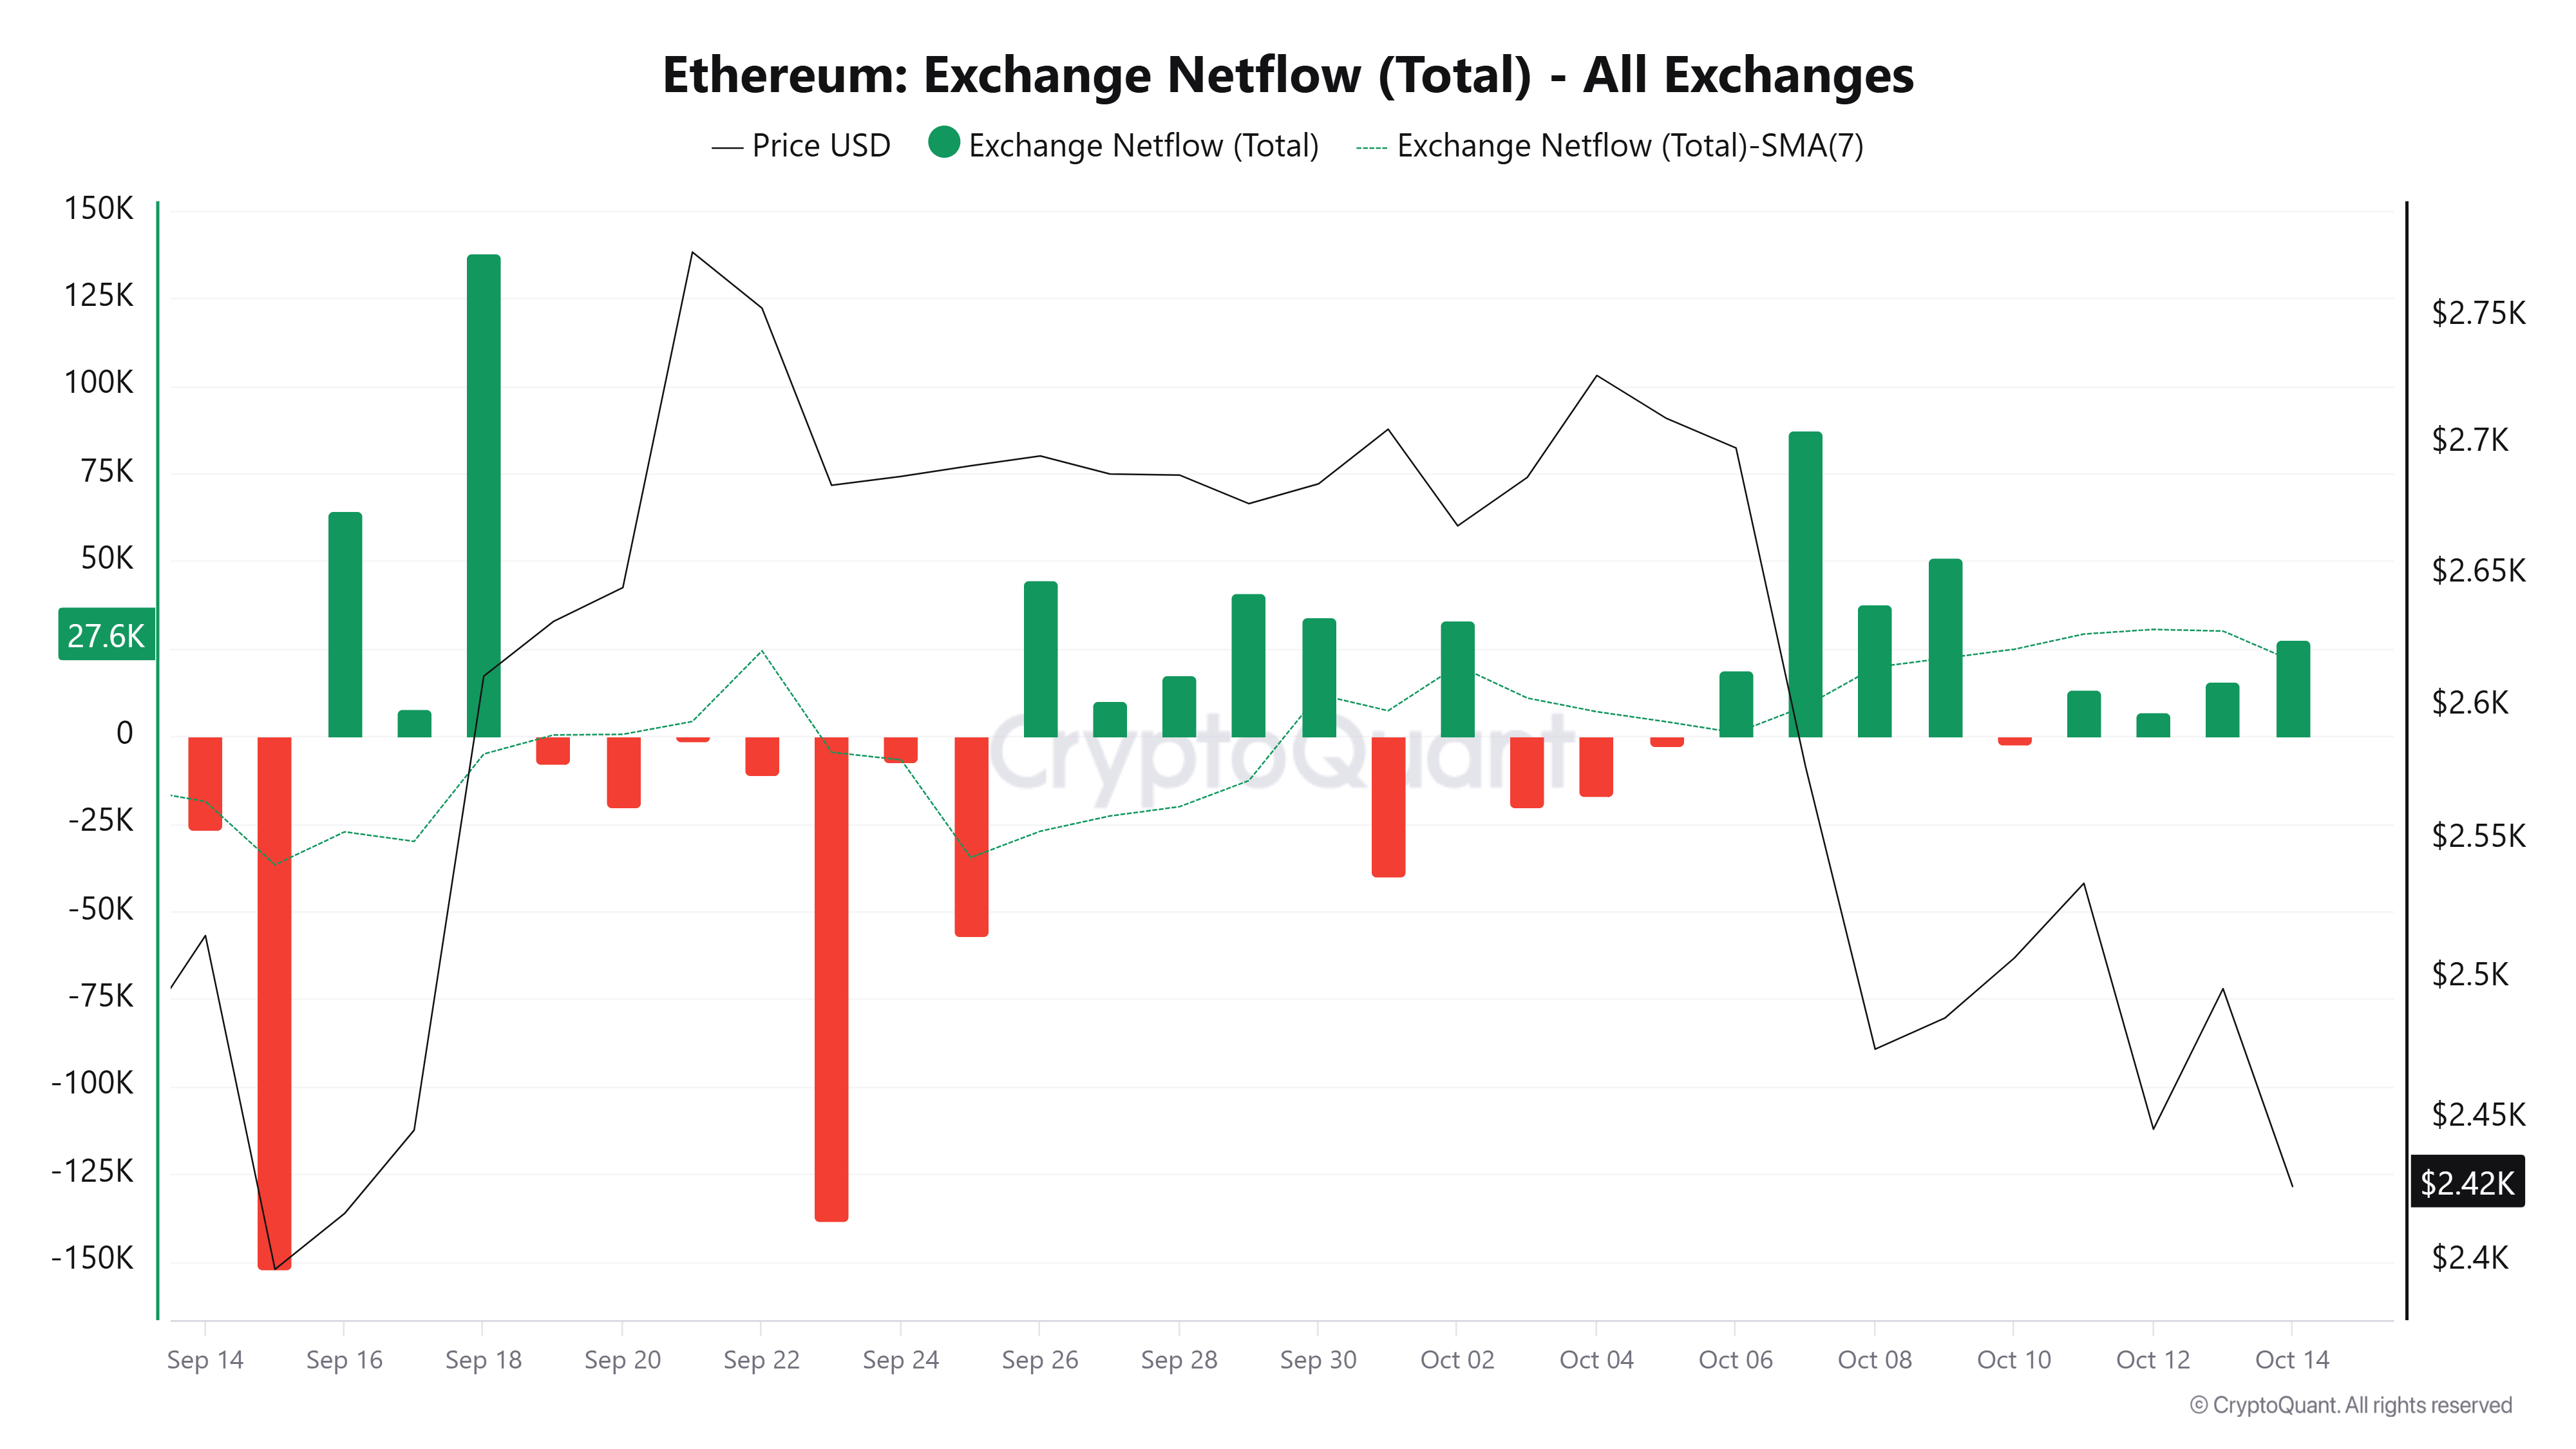
Selling pressure isn't restricted to the derivatives market. ETH Exchange Netflow, which measures the difference between coins flowing in and out of exchanges, has maintained a positive trend since Sunday, similar to last week. The move indicates more coins are entering exchanges than leaving, a signal that has historically correlated with increased selling pressure, as shown in the chart below.
Ethereum technical outlook: ETH struggles at $2,548
On the daily chart, ETH retains a bearish near-term bias as price holds below the 50-day and 20-day Exponential Moving Averages (EMAs) at $2,498 and $2,563, respectively. Although it continues to trade above the 100-day EMA at $2,353, which offers some underlying trend support, a failure to reclaim the short-term EMAs hints at a capped recovery.
The 14-day Relative Strength Index (RSI) sits near 38, while the Stochastic Oscillator (Stoch) hovers around 7, suggesting weak momentum and an oversold tone that could slow, but not yet reverse, the prevailing downside pressure.
On the topside, initial resistance is seen at the 50-day EMA, followed by the horizontal barrier at $2,548 and the 20-day EMA, which together form a dense supply zone before the $2,636 level and the higher cap at $2,781.
On the downside, immediate support aligns with the recent close at $2,432, ahead of the horizontal floor at $2,355 and the 100-day EMA at $2,353, with deeper cushions seen at $2,204 and $1,971 if selling pressure resumes.
(The technical analysis of this story was written with the help of an AI tool. Know more.)
Artículos destacados
1South Korean Won: BoK welcomes stronger Won – Commerzbank2Australia Unemployment Rate set to remain at a five-year high of 4.6% in September3Ethereum Price Forecast: ETH falls below $2,500 as hot CPI raises Fed hike odds4Mexican Peso suffer sharp losses as US inflation boosts the Dollar5Fed’s Goolsbee warns hot CPI unacceptable as services inflation bites6Singapore Dollar: MAS surprise hold signals extended pause – MUFG7Fed’s Barkin says CPI ran too hot, keeps October decision open8EUR/USD Price Forecast: Strong US CPI keeps bears in control despite oversold RSI9Fed Beige Book flags price pressures intensifying
COTIZACIONES EN VIVO


TODO SOBRE TECHNICAL
Backtesting in Trading: What It Is and How to Backtest a Strategy
RSI Divergence: Bullish, Bearish and Hidden Divergence Explained
What Is ICT Trading? Inner Circle Trader Concepts Explained
Support and Resistance: Meaning, Types, How to Draw Levels & Trading Strategies
What Is Liquidity? Meaning in Trading and Financial Markets
Liquidity Sweep: Meaning, Examples & Trading Strategy
Market Structure in Trading: The Complete Guide (Bullish, Bearish, Sideways)
Change of Character (CHoCH): Definition, Examples & Strategy
What Is the Bullish Kicker Pattern and How to Trade It?
¡Comience ahora!
Regístrese y acceda a los mercados globales en menos de 3 minutos

Conéctese con nosotros









Contactos
Teléfono: +61 2 8036 8388
Fax: +61 2 8036 8388
Correo electrónico: support@tmgm.com



La información proporcionada en este sitio web es únicamente de carácter general y no constituye asesoramiento financiero personal. Antes de actuar sobre cualquier información de este sitio web, debe considerar la idoneidad de la información en relación con sus objetivos, situación financiera y necesidades. Invertir en CFD y contratos de margen de FX conlleva riesgos significativos y no es adecuado para todos los inversores. Puede perder más que su depósito inicial. Usted no posee ni tiene ningún interés en el activo subyacente. Le recomendamos que busque asesoramiento independiente y se asegure de comprender plenamente los riesgos involucrados antes de operar. Es importante que lea y considere el documento de divulgación antes de adquirir cualquier producto listado en el sitio web. La información y los anuncios ofrecidos en este sitio web no están destinados al uso por parte de ninguna persona en ningún país o jurisdicción donde dicho uso sea contrario a las leyes y regulaciones locales. Los productos y servicios ofrecidos en este sitio web no están destinados a residentes de Estados Unidos, Malasia y Tailandia.
TMGM está autorizado y regulado en varias jurisdicciones.
Trademax Australia Limited, que opera como TMGM, está regulada por la Comisión Australiana de Valores e Inversiones (ASIC), AFSL n.º 436416, y está ubicada en Level 28, One International Tower, 100 Barangaroo Avenue, 2000 Sydney, NSW Australia.
Correo electrónico: support@tmgm.com.au
Trademax Global Limited, que opera como TMGM, está autorizada y regulada por la Comisión de Servicios Financieros de Vanuatu (VFSC), número de registro 40356, y está registrada en 1276, Kumul Highway, Port Vila, Vanuatu, República de Vanuatu.
Correo electrónico: support@tmgm.com
Trademax Global Markets (SE) Limited, que opera como TMGM, está autorizada y regulada por la Autoridad de Servicios Financieros (FSA) de Seychelles, con número de licencia SD224. La empresa está registrada en Office No 13, Providence Estate ABIS Centre, Mahe, Seychelles.
Correo electrónico: support@tmgm.com
Trademax Global Markets (International) Pty Ltd, que opera como TMGM, está autorizada y regulada por la Comisión de Servicios Financieros de Mauricio (FSC) con licencia n.º GB22201012, y está registrada en 33, Edith Cavell Street C/o IQ EQ Fund Services (Mauritius) Ltd Port Louis, 11324 Mauricio.
Correo electrónico: support@tmgm.com
Copyright © TMGM. Todos los derechos reservados