

Trading
Explora una amplia gama de mercados con precios competitivos, liquidez profunda y herramientas de trading avanzadas.
Más información 
Plataforma
Opera sin interrupciones con la potente plataforma de TMGM, diseñada para ofrecer velocidad, precisión y una experiencia de trading superior.
Más información Plataforma de trading
Herramientas de trading
Academia
Aprende los fundamentos del trading con recursos ideales para principiantes, incluidas guías, seminarios web y análisis del mercado.
Más información Academia TMGM
Noticias y análisis
Obtén actualizaciones del mercado en tiempo real y análisis de expertos para adelantarte a las oportunidades de trading
Más información Noticias y análisis
Acerca de
Descubre qué distingue a TMGM: nuestra presencia global, solidez regulatoria y compromiso con la innovación en el trading.
Más información Por qué elegir TMGM
Pi Network Price Forecast: Weak momentum and waning demand reinforce downside bias
- Pi Network edges lower on Monday, risking a break below its immediate near-term support around $0.0774.
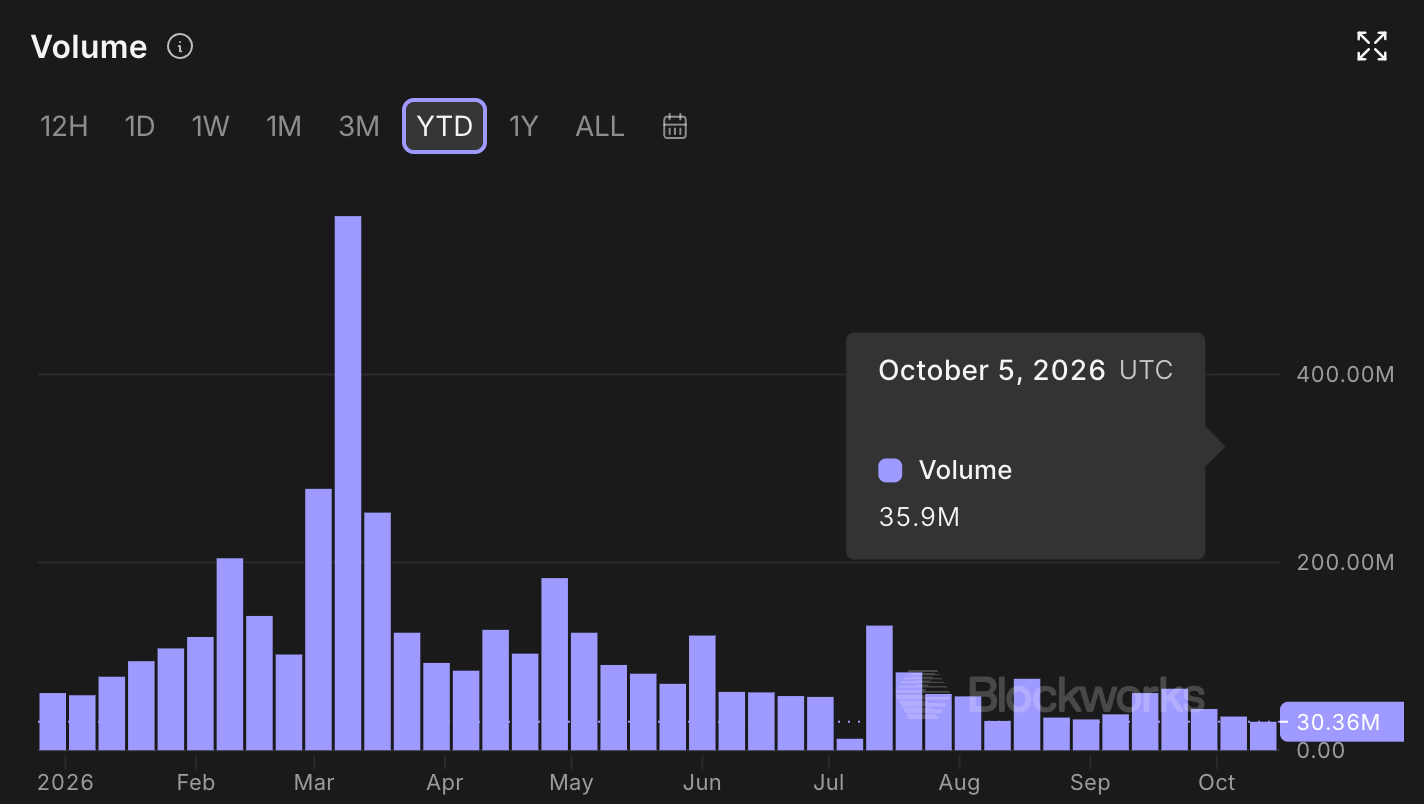
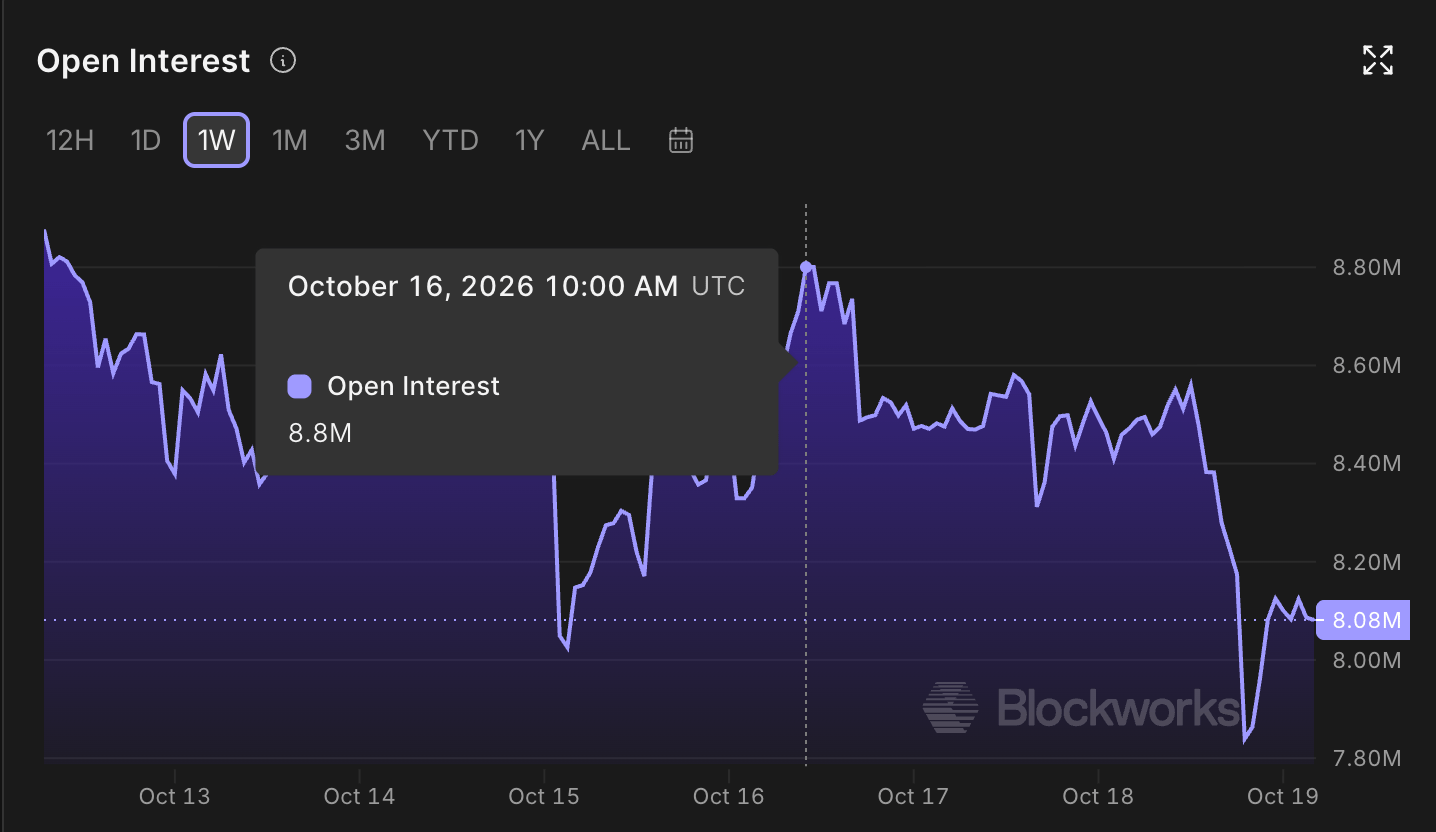
- Declining PI futures Open Interest and weekly spot trading volume suggest reduced demand among traders.
- The technical outlook for PI indicates a downside bias as momentum remains weak.
Pi Network (PI) edges lower on Monday, risking a bearish conclusion to its short-term consolidation above the $0.0774 horizontal support. A steady decline in the notional value of active PI futures contracts and the weekly spot trading volume suggests reduced retail demand. The PI token risks a retest of its record low around $0.0704 as bearish momentum remains dominant on the daily chart.

Pi Network loses retail support
Pi Network is in a long-term bearish trend, weighing on investors' confidence. Blockworks data shows PI is losing demand in the retail space, with weekly spot trading volume dropping to 30.36 million last week, extending a steady decline over the last four weeks after the $65.52 million peak in late September.
Similarly, the derivatives market is seeing reduced demand in PI futures. Blockworks data shows PI futures Open Interest (OI) is down to $8.08 million on Monday, from $8.80 million on Friday, suggesting a lower notional value of active contracts, driven by a lower spot price or a positional wipeout.
Technical outlook: Will Pi Network extend its decline to a fresh record low?
Pi Network trades around $0.0786 at press time on Monday, maintaining a long-term bearish bias. The PI token remains capped beneath the 50-day Exponential Moving Average (EMA) at $0.0865 and the broken downward trendline, which connects the June 20 and August 22 highs, at $0.0843.
From a technical perspective, the 23.6% Fibonacci retracement level, measured from $0.1394 to $0.0704, at $0.0866 reinforces the overhead barrier near the declining resistance trendline. To reinstate an upward trend, PI must surpass the 50-day EMA at $0.0865, which could extend the recovery toward the 50% retracement level at $0.1049.
The Relative Strength Index (RSI) at 37 signals soft but not extreme downside momentum, and the Moving Average Convergence Divergence (MACD) line remains marginally below its signal line, which together hint that sellers still retain control.
On the downside, the immediate technical floor is at the October 8 low of $0.0774, guarding the Fibonacci anchor at $0.0704. A decisive break beneath this structural low would open the door to a deeper bearish extension into untested waters.
(The technical analysis of this story was written with the help of an AI tool. Know more.)
Artículos destacados
1Crypto Today: Bitcoin, Ethereum, XRP extend recovery despite ETFs outflows2Japanese Yen: Mild upside bias against US Dollar within range - UOB3Pi Network Price Forecast: Weak momentum and waning demand reinforce downside bias4Canadian Dollar: Strength against US Dollar tests key levels – Societe Generale5Gold Price Forecast: XAU/USD bids its time below $4,200 in a dozy week opening6Silver price today: Silver rises, according to FXStreet data7Oil: Supply risks offset reserve releases – OCBC8Euro drops against Canadian Dollar amid wave of protests in Europe9US Dollar: AI-linked flows weigh on outlook – MUFG
COTIZACIONES EN VIVO

TODO SOBRE TECHNICAL
Butterfly Pattern Trading: How to Identify and Trade the Butterfly Harmonic Pattern
What Is a Rising Wedge Pattern and How Do You Trade It?
What Is a Descending Triangle Pattern and How Do You Trade It?
Accumulation, Manipulation and Distribution (AMD): ICT Power of 3 Trading Guide
Backtesting in Trading: What It Is and How to Backtest a Strategy
RSI Divergence: Bullish, Bearish and Hidden Divergence Explained
What Is ICT Trading? Inner Circle Trader Concepts Explained
Support and Resistance: Meaning, Types, How to Draw Levels & Trading Strategies
What Is Liquidity? Meaning in Trading and Financial Markets
¡Comience ahora!
Regístrese y acceda a los mercados globales en menos de 3 minutos

Conéctese con nosotros









Contactos
Teléfono: +61 2 8036 8388
Fax: +61 2 8036 8388
Correo electrónico: support@tmgm.com



La información proporcionada en este sitio web es únicamente de carácter general y no constituye asesoramiento financiero personal. Antes de actuar sobre cualquier información de este sitio web, debe considerar la idoneidad de la información en relación con sus objetivos, situación financiera y necesidades. Invertir en CFD y contratos de margen de FX conlleva riesgos significativos y no es adecuado para todos los inversores. Puede perder más que su depósito inicial. Usted no posee ni tiene ningún interés en el activo subyacente. Le recomendamos que busque asesoramiento independiente y se asegure de comprender plenamente los riesgos involucrados antes de operar. Es importante que lea y considere el documento de divulgación antes de adquirir cualquier producto listado en el sitio web. La información y los anuncios ofrecidos en este sitio web no están destinados al uso por parte de ninguna persona en ningún país o jurisdicción donde dicho uso sea contrario a las leyes y regulaciones locales. Los productos y servicios ofrecidos en este sitio web no están destinados a residentes de Estados Unidos, Malasia y Tailandia.
TMGM está autorizado y regulado en varias jurisdicciones.
Trademax Australia Limited, que opera como TMGM, está regulada por la Comisión Australiana de Valores e Inversiones (ASIC), AFSL n.º 436416, y está ubicada en Level 28, One International Tower, 100 Barangaroo Avenue, 2000 Sydney, NSW Australia.
Correo electrónico: support@tmgm.com.au
Trademax Global Limited, que opera como TMGM, está autorizada y regulada por la Comisión de Servicios Financieros de Vanuatu (VFSC), número de registro 40356, y está registrada en 1276, Kumul Highway, Port Vila, Vanuatu, República de Vanuatu.
Correo electrónico: support@tmgm.com
Trademax Global Markets (SE) Limited, que opera como TMGM, está autorizada y regulada por la Autoridad de Servicios Financieros (FSA) de Seychelles, con número de licencia SD224. La empresa está registrada en Office No 13, Providence Estate ABIS Centre, Mahe, Seychelles.
Correo electrónico: support@tmgm.com
Trademax Global Markets (International) Pty Ltd, que opera como TMGM, está autorizada y regulada por la Comisión de Servicios Financieros de Mauricio (FSC) con licencia n.º GB22201012, y está registrada en 33, Edith Cavell Street C/o IQ EQ Fund Services (Mauritius) Ltd Port Louis, 11324 Mauricio.
Correo electrónico: support@tmgm.com
Copyright © TMGM. Todos los derechos reservados