

Trading
Explora una amplia gama de mercados con precios competitivos, liquidez profunda y herramientas de trading avanzadas.
Más información 
Plataforma
Opera sin interrupciones con la potente plataforma de TMGM, diseñada para ofrecer velocidad, precisión y una experiencia de trading superior.
Más información Plataforma de trading
Herramientas de trading
Academia
Aprende los fundamentos del trading con recursos ideales para principiantes, incluidas guías, seminarios web y análisis del mercado.
Más información Academia TMGM
Noticias y análisis
Obtén actualizaciones del mercado en tiempo real y análisis de expertos para adelantarte a las oportunidades de trading
Más información Noticias y análisis
Acerca de
Descubre qué distingue a TMGM: nuestra presencia global, solidez regulatoria y compromiso con la innovación en el trading.
Más información Por qué elegir TMGM
US 10-year yield revisits 2007 heights as curve flirts with inversion
- US 10-year yield hits 5.274%, its highest since June 2007.
- Curve flattens as investors price additional Fed tightening.
- GDP, Core PCE and NFP headline this week’s catalysts.
US Treasury yields climb as energy prices remain high, amid US President Donald Trump's rejection of a peace agreement with Tehran. Also, investors pricing in further tightening by the Federal Reserve to tackle high inflation above the central bank’s 2% goal is another reason for investors demanding a higher premium on US debt.
Energy risks and Fed tightening bets keep pressure on US debt
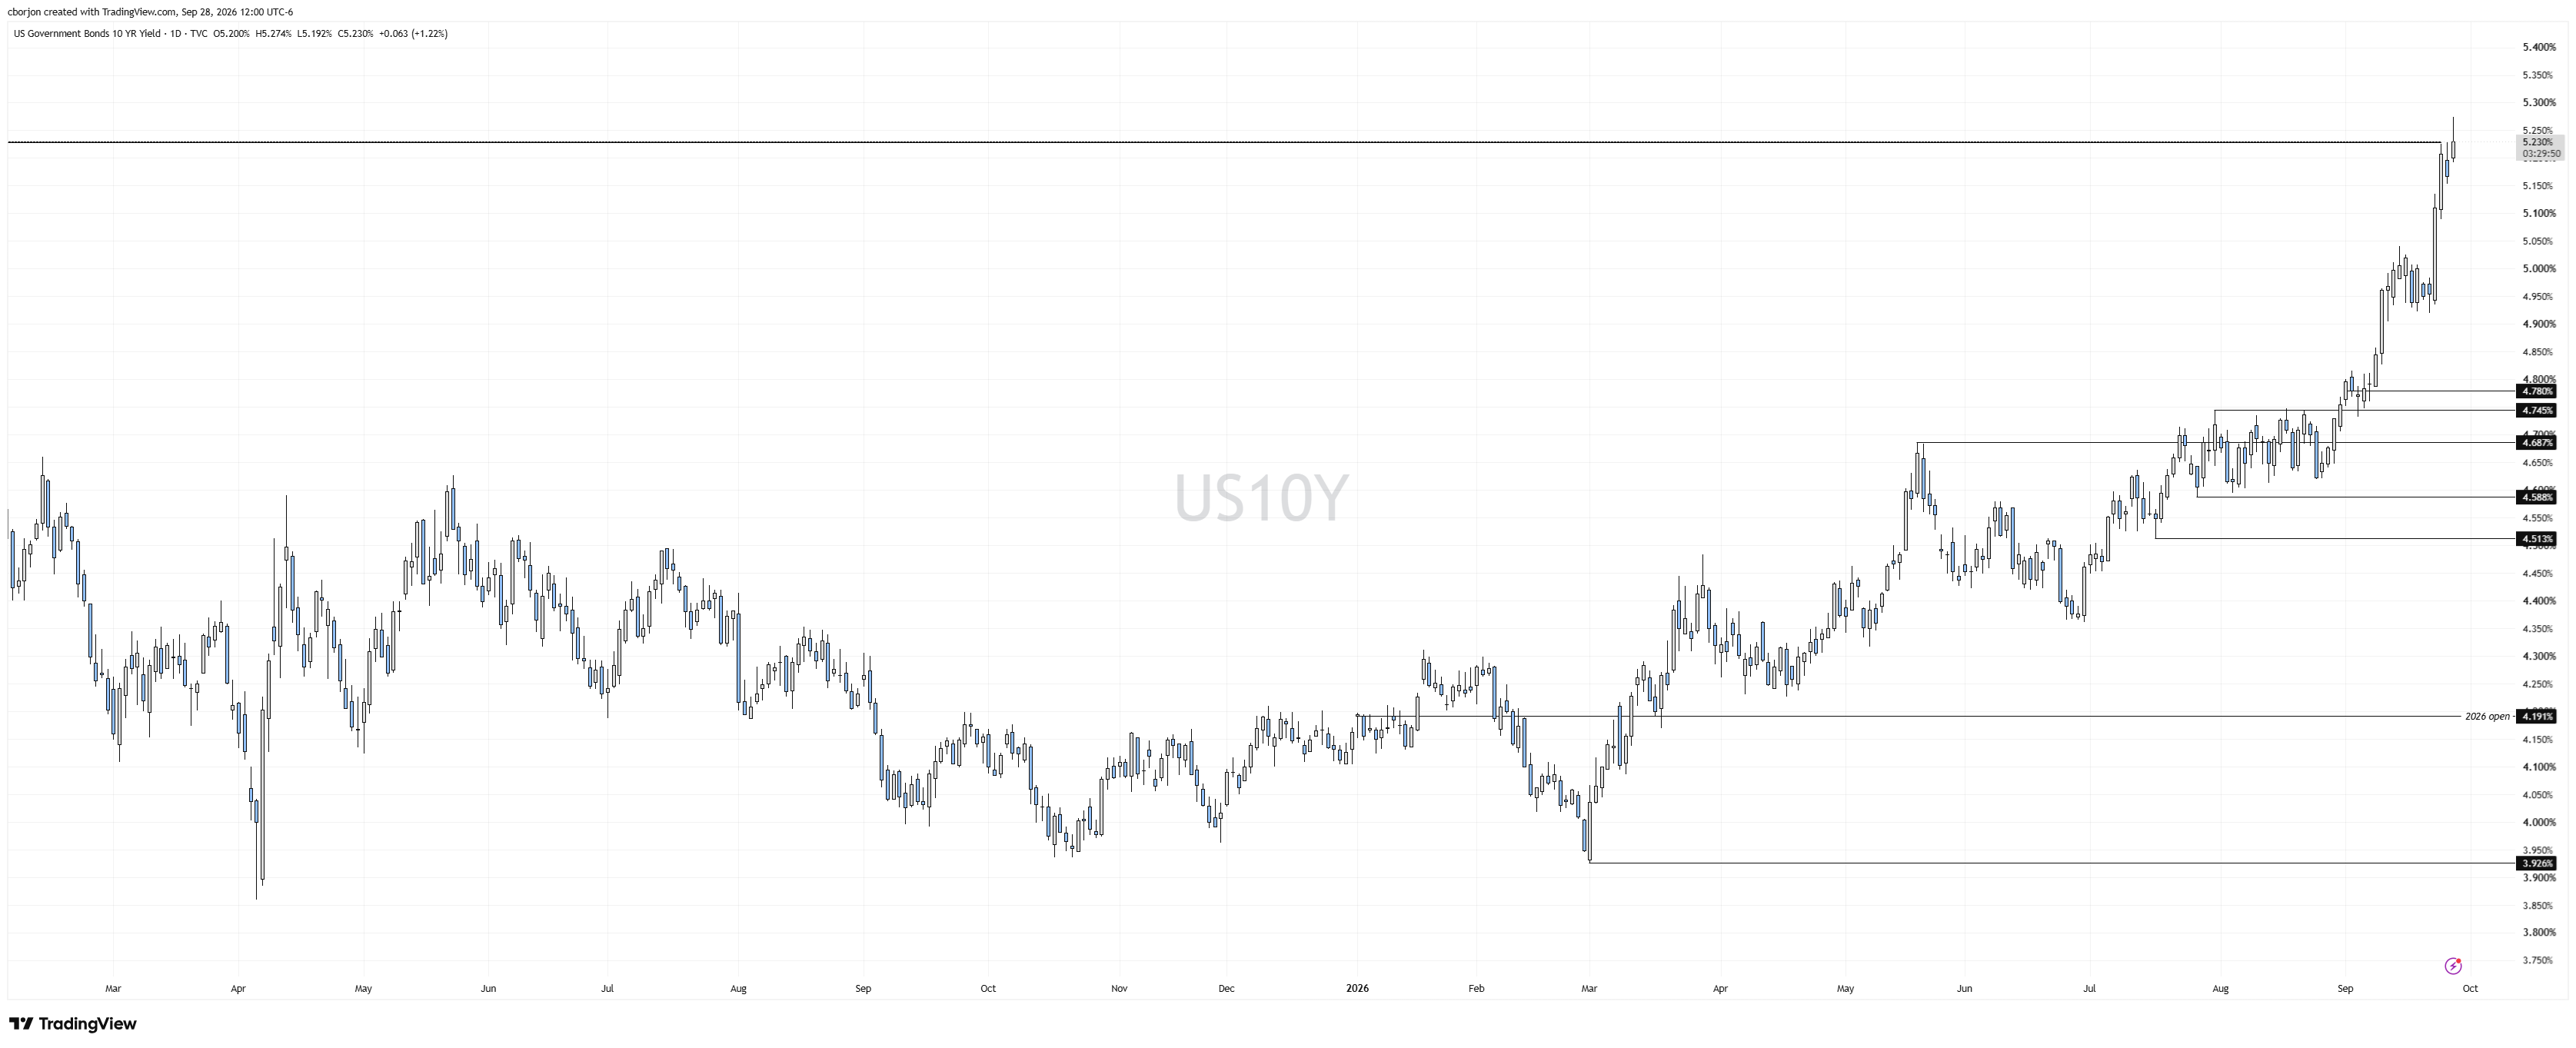
The US 10-year Treasury note yield rose to its highest level since June 2007 at 5.274%, before trimming some of its gains to 5.247%, up over eight basis points.
In the meantime, contradictory US-Iran news headlines keep the financial markets volatile. News that Iran agreed to halt its uranium enrichment program, reported by Al Hadath, was followed by Al Arabiya reporting that the chances of an agreement between the two countries are extremely slim, according to a US source involved in negotiations with Tehran.
Fed speaking is keeping US Treasury yields higher as well. Governor Lisa Cook was hawkish, expecting continued inflationary pressures in the coming months from AI and hostilities in the Middle East.
Consequently, traders still see a 65% chance of a 25-basis-point rate hike by the Federal Reserve at the October meeting. Although it seems like a coin flip, the December meeting is almost certain, with odds of 94%, according to Prime Terminal data.
Meanwhile, the US 30-year bond yield is up almost 7 basis points to 5.559%.
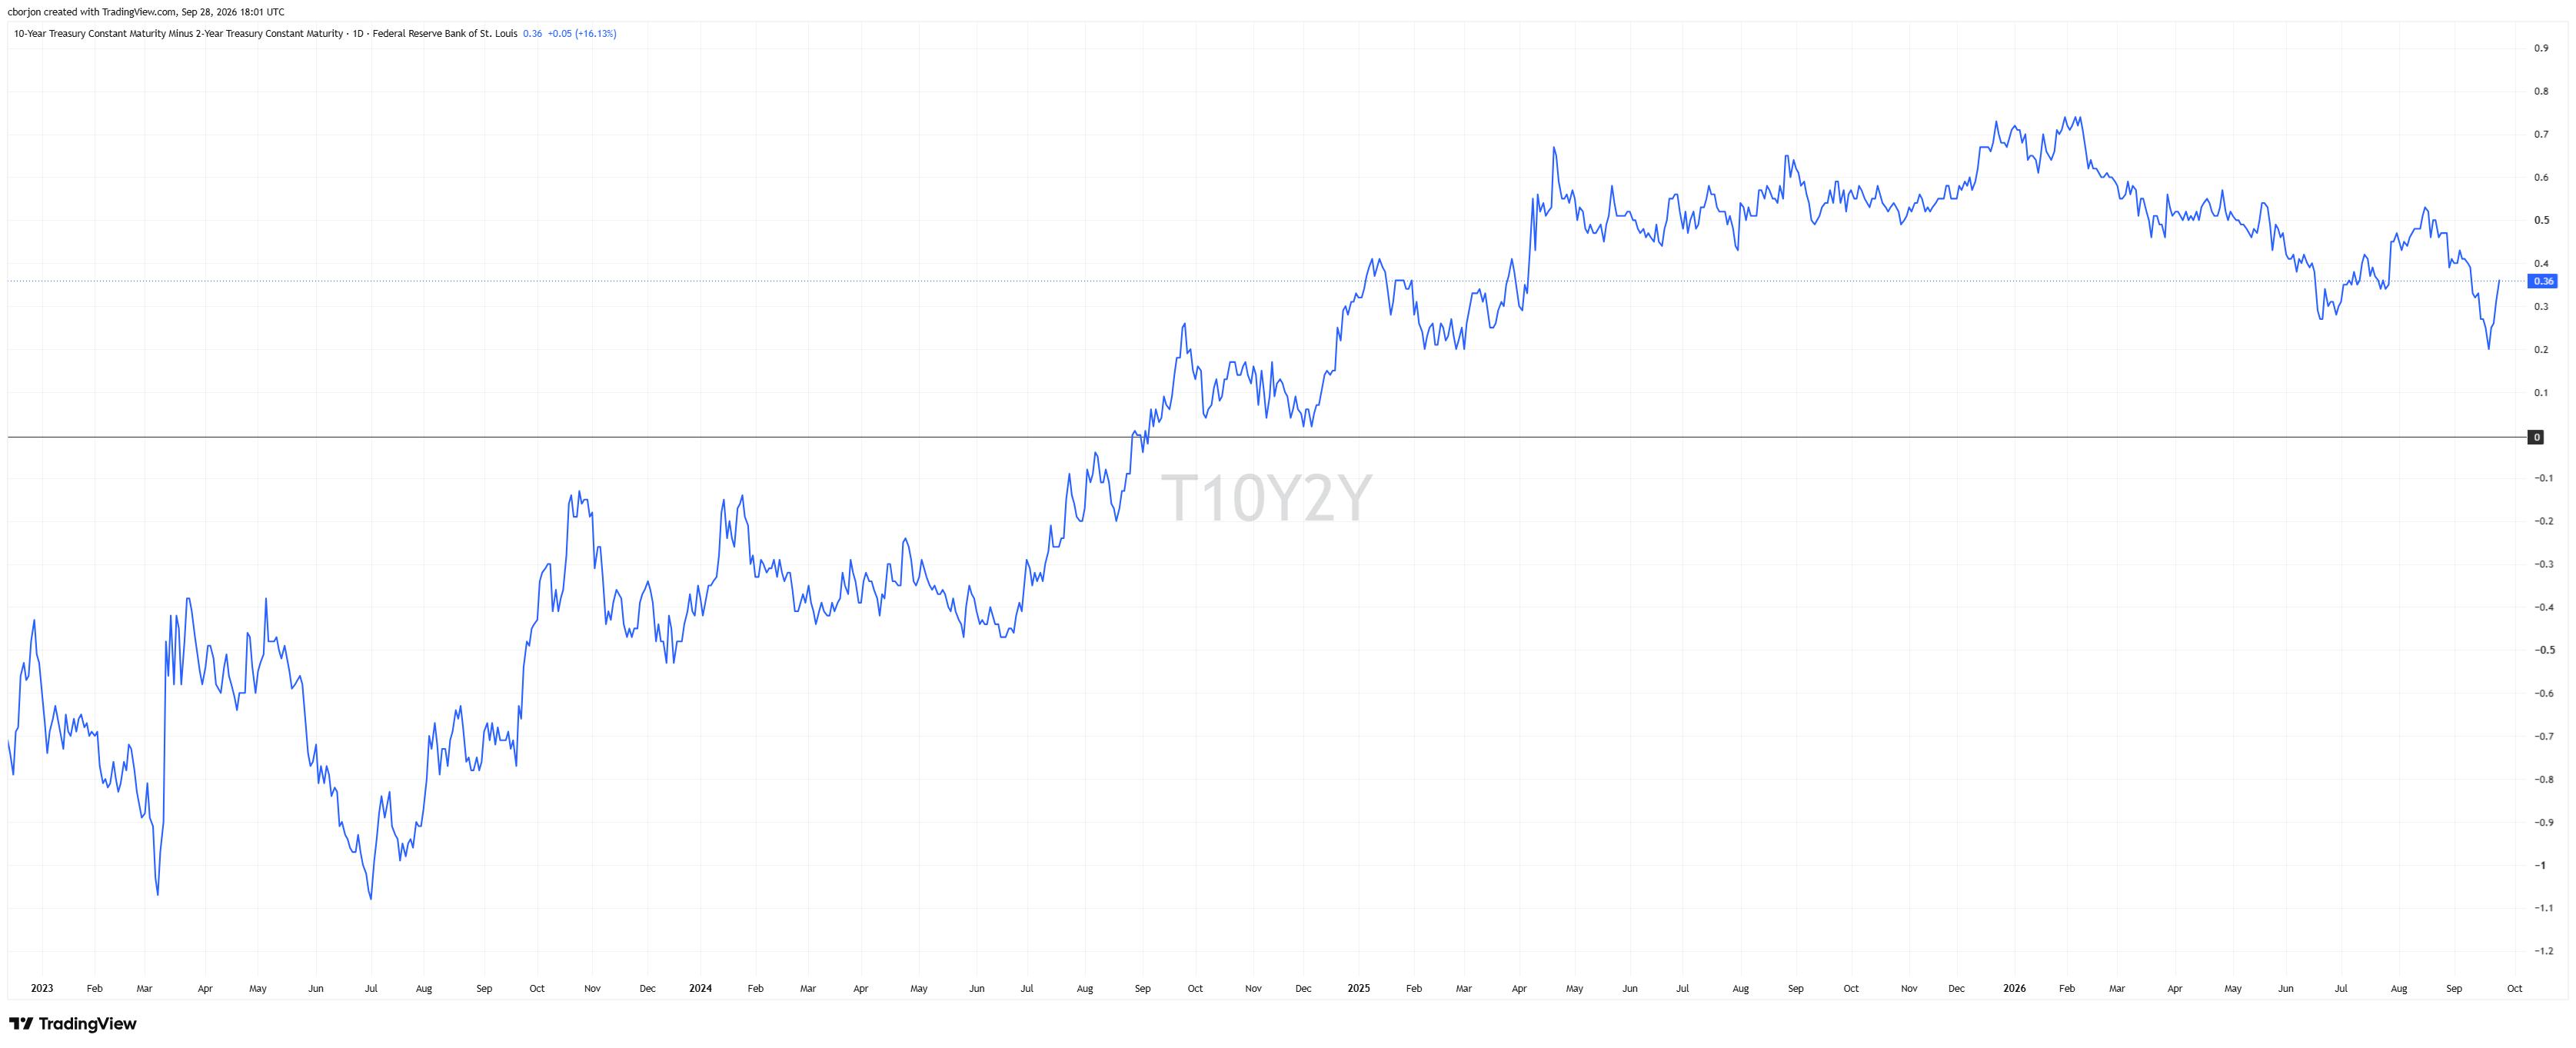
Worth noting that the yield differential between the US 10-year and the US 2-year narrowed to as low as 17 basis points, an indication that a possible yield curve inversion looms, as it flattens on expectations of further tightening.
Ahead, the US economic docket will feature GDP data, the Fed’s preferred inflation gauge, the Core Personal Consumption Expenditures (PCE) Price Index and September’s US Nonfarm Payrolls on Friday.
US 10-year Treasury yield
Interest rates FAQs
Interest rates are charged by financial institutions on loans to borrowers and are paid as interest to savers and depositors. They are influenced by base lending rates, which are set by central banks in response to changes in the economy. Central banks normally have a mandate to ensure price stability, which in most cases means targeting a core inflation rate of around 2%. If inflation falls below target the central bank may cut base lending rates, with a view to stimulating lending and boosting the economy. If inflation rises substantially above 2% it normally results in the central bank raising base lending rates in an attempt to lower inflation.
Higher interest rates generally help strengthen a country’s currency as they make it a more attractive place for global investors to park their money.
Higher interest rates overall weigh on the price of Gold because they increase the opportunity cost of holding Gold instead of investing in an interest-bearing asset or placing cash in the bank. If interest rates are high that usually pushes up the price of the US Dollar (USD), and since Gold is priced in Dollars, this has the effect of lowering the price of Gold.
The Fed funds rate is the overnight rate at which US banks lend to each other. It is the oft-quoted headline rate set by the Federal Reserve at its FOMC meetings. It is set as a range, for example 4.75%-5.00%, though the upper limit (in that case 5.00%) is the quoted figure. Market expectations for future Fed funds rate are tracked by the CME FedWatch tool, which shapes how many financial markets behave in anticipation of future Federal Reserve monetary policy decisions.
Artículos destacados
1Japanese Yen trades cautiously as intervention risk clashes with Fed rate hike bets2Strategy buys 1,665 Bitcoin amid renewed geopolitical tensions3Forex Today: The RBA and Fedspeak grab all the attention4US 10-year yield revisits 2007 heights as curve flirts with inversion5Crude Oil round-trips between a rejected Iran plan and a sanctions offer6Fed’s Cook says AI, Iran risks could keep inflation pressures high7US President Trump to ease sanctions on Iran over nuclear progress8USD: Speculative longs steady as Fed hikes – Rabobank9Bitcoin vs Gold Outlook: BTC pulls back alongside XAU/USD ahead of US-Iran indirect talks
COTIZACIONES EN VIVO


¡Comience ahora!
Regístrese y acceda a los mercados globales en menos de 3 minutos

Conéctese con nosotros









Contactos
Teléfono: +61 2 8036 8388
Fax: +61 2 8036 8388
Correo electrónico: support@tmgm.com



La información proporcionada en este sitio web es únicamente de carácter general y no constituye asesoramiento financiero personal. Antes de actuar sobre cualquier información de este sitio web, debe considerar la idoneidad de la información en relación con sus objetivos, situación financiera y necesidades. Invertir en CFD y contratos de margen de FX conlleva riesgos significativos y no es adecuado para todos los inversores. Puede perder más que su depósito inicial. Usted no posee ni tiene ningún interés en el activo subyacente. Le recomendamos que busque asesoramiento independiente y se asegure de comprender plenamente los riesgos involucrados antes de operar. Es importante que lea y considere el documento de divulgación antes de adquirir cualquier producto listado en el sitio web. La información y los anuncios ofrecidos en este sitio web no están destinados al uso por parte de ninguna persona en ningún país o jurisdicción donde dicho uso sea contrario a las leyes y regulaciones locales. Los productos y servicios ofrecidos en este sitio web no están destinados a residentes de Estados Unidos, Malasia y Tailandia.
TMGM está autorizado y regulado en varias jurisdicciones.
Trademax Australia Limited, que opera como TMGM, está regulada por la Comisión Australiana de Valores e Inversiones (ASIC), AFSL n.º 436416, y está ubicada en Level 28, One International Tower, 100 Barangaroo Avenue, 2000 Sydney, NSW Australia.
Correo electrónico: support@tmgm.com.au
Trademax Global Limited, que opera como TMGM, está autorizada y regulada por la Comisión de Servicios Financieros de Vanuatu (VFSC), número de registro 40356, y está registrada en 1276, Kumul Highway, Port Vila, Vanuatu, República de Vanuatu.
Correo electrónico: support@tmgm.com
Trademax Global Markets (SE) Limited, que opera como TMGM, está autorizada y regulada por la Autoridad de Servicios Financieros (FSA) de Seychelles, con número de licencia SD224. La empresa está registrada en Office No 13, Providence Estate ABIS Centre, Mahe, Seychelles.
Correo electrónico: support@tmgm.com
Trademax Global Markets (International) Pty Ltd, que opera como TMGM, está autorizada y regulada por la Comisión de Servicios Financieros de Mauricio (FSC) con licencia n.º GB22201012, y está registrada en 33, Edith Cavell Street C/o IQ EQ Fund Services (Mauritius) Ltd Port Louis, 11324 Mauricio.
Correo electrónico: support@tmgm.com
Copyright © TMGM. Todos los derechos reservados