

USD/CHF Price Forecast: Pair consolidates around the 50-day SMA
- USD/CHF edges lower as broad Japanese Yen strength keeps the US Dollar under pressure.
- The Swiss Franc struggles to fully benefit as its role as a carry-trade funding currency limits demand.
- USD/CHF holds near the 50-day SMA, while neutral RSI and a slightly positive MACD point to balanced momentum.
USD/CHF trades with a downside bias on Monday as the US Dollar (USD) stays on the defensive, largely due to broad Japanese Yen (JPY) strength. At the time of writing, the pair trades around 0.8091 after retreating from an intraday high of 0.8110. USD/JPY falls to a six-and-a-half-month low near 154.40, while the US Dollar Index (DXY) hovers near a two-week low around 98.90.

The Greenback weakens despite escalating tensions in the Middle East, which are adding to inflation concerns through higher Oil prices. Combined with Friday’s robust US employment report, elevated energy costs reinforce expectations of Federal Reserve (Fed) interest rate hikes. US Producer Price Index (PPI) and Consumer Price Index (CPI) data due later this week will be closely watched ahead of the Fed’s September 15-16 policy meeting.
However, the Swiss Franc (CHF) struggles to capitalise on US Dollar weakness. As expectations of further monetary policy tightening by the Bank of Japan (BoJ) make the Yen less attractive for funding carry trades, the Franc has emerged as an alternative due to the Swiss National Bank’s (SNB) 0% policy rate. Meanwhile, the SNB’s readiness to intervene in the foreign exchange market to curb any sharp appreciation of the Franc also limits demand for the currency.
Technical Analysis
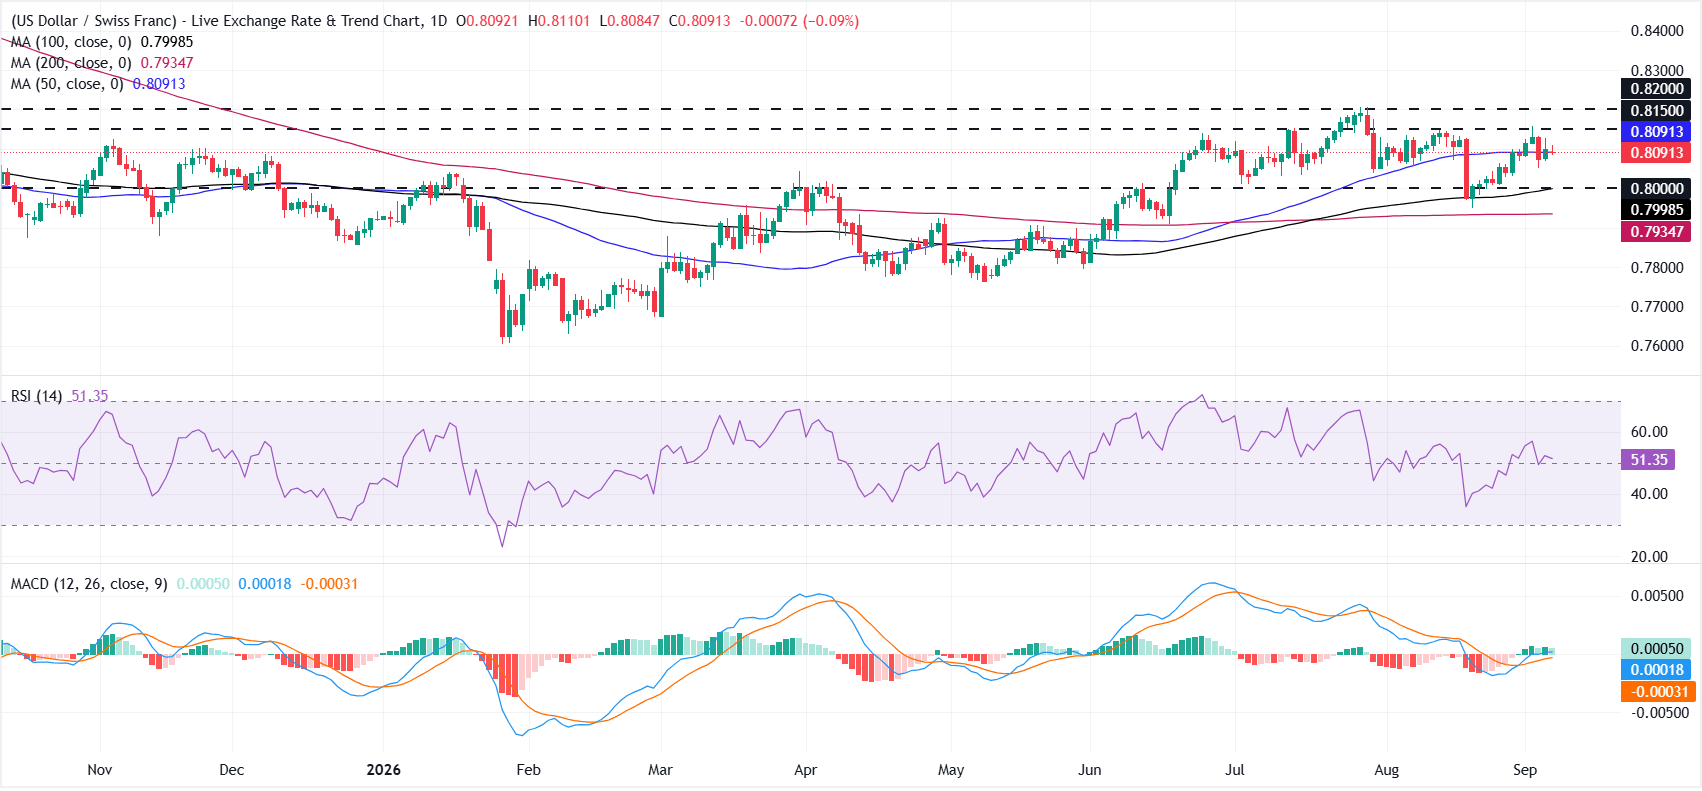
On the daily chart, USD/CHF holds near the 50-day Simple Moving Average (SMA) around 0.8091, keeping the near-term outlook neutral, with the broader structure still supported by the 100-day and 200-day SMAs.
The Relative Strength Index (RSI) near 51 suggests balanced momentum, while the Moving Average Convergence Divergence (MACD) stays marginally positive, hinting at a modestly constructive bias as long as the pair holds above its underlying moving-average floor.
On the upside, initial resistance is seen near 0.8150, followed by the 0.8200 mark. A clear break above these levels could open the door to further gains toward territory last seen in May 2025.
On the downside, immediate support is seen at the psychological 0.8000 level, reinforced by the 100-day SMA just beneath it and then by the longer-term 200-day SMA around 0.7935, with a daily close below this zone needed to expose a deeper bearish extension.
(The technical analysis of this story was written with the help of an AI tool. Know more.)
Swiss Franc Price Today
The table below shows the percentage change of Swiss Franc (CHF) against listed major currencies today. Swiss Franc was the strongest against the New Zealand Dollar.
| USD | EUR | GBP | JPY | CAD | AUD | NZD | CHF | |
|---|---|---|---|---|---|---|---|---|
| USD | -0.11% | -0.17% | -1.16% | -0.17% | -0.20% | 0.06% | -0.09% | |
| EUR | 0.11% | -0.05% | -1.06% | -0.09% | -0.09% | 0.16% | 0.03% | |
| GBP | 0.17% | 0.05% | -1.00% | -0.02% | -0.03% | 0.22% | 0.07% | |
| JPY | 1.16% | 1.06% | 1.00% | 1.02% | 0.99% | 1.26% | 1.13% | |
| CAD | 0.17% | 0.09% | 0.02% | -1.02% | -0.04% | 0.22% | 0.06% | |
| AUD | 0.20% | 0.09% | 0.03% | -0.99% | 0.04% | 0.26% | 0.10% | |
| NZD | -0.06% | -0.16% | -0.22% | -1.26% | -0.22% | -0.26% | -0.15% | |
| CHF | 0.09% | -0.03% | -0.07% | -1.13% | -0.06% | -0.10% | 0.15% |
The heat map shows percentage changes of major currencies against each other. The base currency is picked from the left column, while the quote currency is picked from the top row. For example, if you pick the Swiss Franc from the left column and move along the horizontal line to the US Dollar, the percentage change displayed in the box will represent CHF (base)/USD (quote).














