

GBP/JPY Price Forecast: Bears Eye 207.00 as downtrend holds
- GBP/JPY falls for third day but avoids fresh lower low.
- Oversold RSI warns of rebound, though bearish bias persists.
- Break below 207.10 exposes 206.78 and 206.00 support.
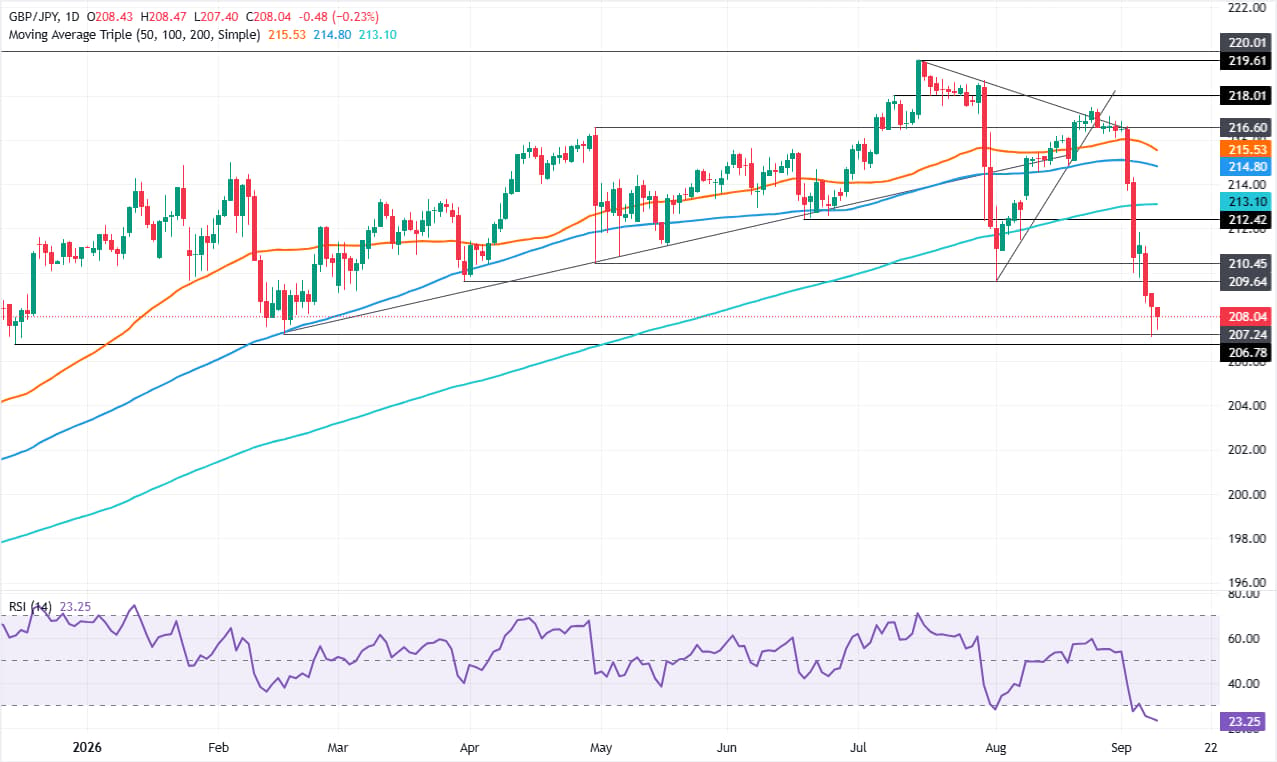
GBP/JPY falls for the third straight day, but it fails to register a lower low, an indication that buyers are stepping in but lack the strength to push the exchange rate past Wednesday’s opening price, leaving the pair near this week's lows. The cross-pair trades at 208.05, down 0.22%.
GBP/JPY Price Forecast: Technical outlook

From a market structure perspective, the GBP/JPY is downward biased after reaching the lowest low in the year of 207.10 on September 8, which could open the door for further downside. Momentum, as measured by the Relative Strength Index (RSI), turned oversold. Yet, due to the speed of the decline, the cross remains downward-biased unless the RSI clears the 30 level.
On the downside, the first support is 208.00. A breach of the latter will expose the YTD low of 207.10. Once hurdled, the next stop is the December 16, 2025, low of 206.78, followed by 206.50 and 206.00.
For a bullish reversal, the GBP/JPY must reclaim the September 8 high of 209.08. Once done, this could form a ‘bullish engulfing’ chart pattern, indicating that buyers have overtaken sellers. In that scenario, the next stop would be 210.00, followed by the 200-day Simple Moving Average (SMA) at 213.09, which would emerge as the next ceiling level.
GBP/JPY Price Chart – Daily
Japanese Yen Price This week
The table below shows the percentage change of Japanese Yen (JPY) against listed major currencies this week. Japanese Yen was the strongest against the New Zealand Dollar.
| USD | EUR | GBP | JPY | CAD | AUD | NZD | CHF | |
|---|---|---|---|---|---|---|---|---|
| USD | -0.16% | -0.20% | -1.55% | -0.20% | -0.27% | 0.70% | 0.13% | |
| EUR | 0.16% | -0.03% | -1.38% | -0.04% | -0.10% | 0.89% | 0.29% | |
| GBP | 0.20% | 0.03% | -1.44% | 0.00% | -0.06% | 0.90% | 0.34% | |
| JPY | 1.55% | 1.38% | 1.44% | 1.45% | 1.36% | 2.36% | 1.75% | |
| CAD | 0.20% | 0.04% | -0.01% | -1.45% | -0.03% | 0.92% | 0.33% | |
| AUD | 0.27% | 0.10% | 0.06% | -1.36% | 0.03% | 0.97% | 0.41% | |
| NZD | -0.70% | -0.89% | -0.90% | -2.36% | -0.92% | -0.97% | -0.61% | |
| CHF | -0.13% | -0.29% | -0.34% | -1.75% | -0.33% | -0.41% | 0.61% |
The heat map shows percentage changes of major currencies against each other. The base currency is picked from the left column, while the quote currency is picked from the top row. For example, if you pick the Japanese Yen from the left column and move along the horizontal line to the US Dollar, the percentage change displayed in the box will represent JPY (base)/USD (quote).














