

Сауда
Бәсекеге қабілетті бағалар, жоғары өтімділік және озық сауда құралдары арқылы нарықтардың кең ауқымын зерттеңіз.
Толығырақ 
Платформа
TMGM-нің жылдамдыққа, дәлдікке және жоғары деңгейлі сауда тәжірибесіне арналған қуатты платформасымен сауданы кедергісіз жүргізіңіз.
Толығырақ Сауда платформасы
Академия
Бастауыштарға арналған нұсқаулықтар, вебинарлар және нарық талдаулары сияқты ресурстар арқылы сауданың негіздерін үйреніңіз.
Толығырақ TMGM Академиясы
Жаңалықтар және талдау
Сауда мүмкіндіктерінен алда болу үшін нақты уақыттағы нарық жаңартулары мен сараптамалық талдауды алыңыз
Толығырақ Жаңалықтар және талдау
Туралы
TMGM-ді ерекшелендіретін жайттарды біліңіз — біздің жаһандық ауқымымыз, реттеушілік беріктігіміз және трейдингтегі инновацияларға деген адалдығымыз.
Толығырақ Неліктен TMGM-ді таңдау керек
Pi Network Price Forecast: PI tests long-term resistance breakout as selling pressure wanes
- Pi Network edges higher on Monday, testing the bullish breakout of a long-term resistance trendline.
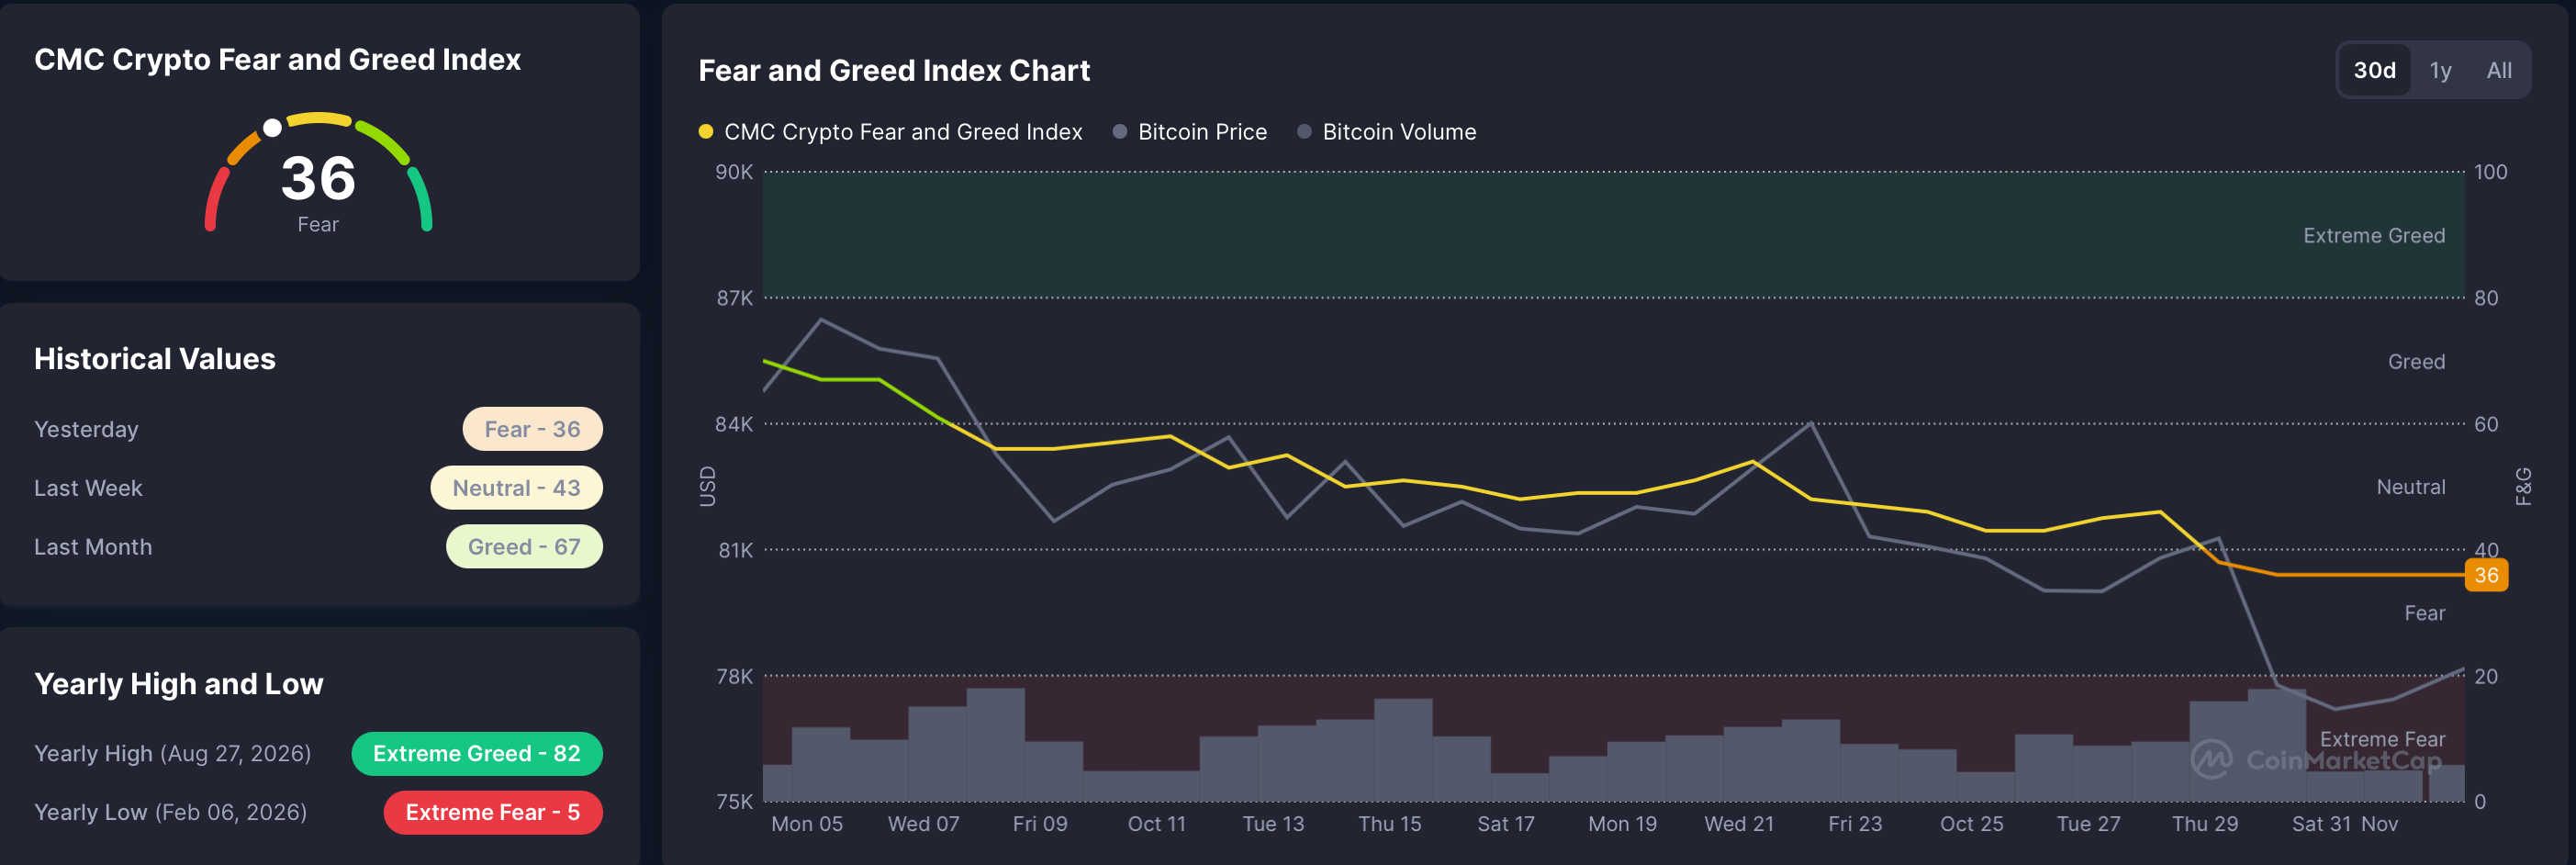
- Fear and Greed Index declines to 36 from 43 last week, indicating reduced risk appetite.
- The technical outlook for the PI token indicates a mild upside bias as momentum recovers.
Pi Network (PI) is trading in the green on Monday, testing the bullish breakout of a long-term resistance trendline around $0.0788. Broader market sentiment is under bearish pressure, weighing on altcoins’ demand, with the Fear and Greed Index down to 36 on Monday from 43 last week. The technical outlook for the PI token indicates a mild upside bias as momentum gains strength.

Pi Network gains retail strength despite weak broader market sentiment
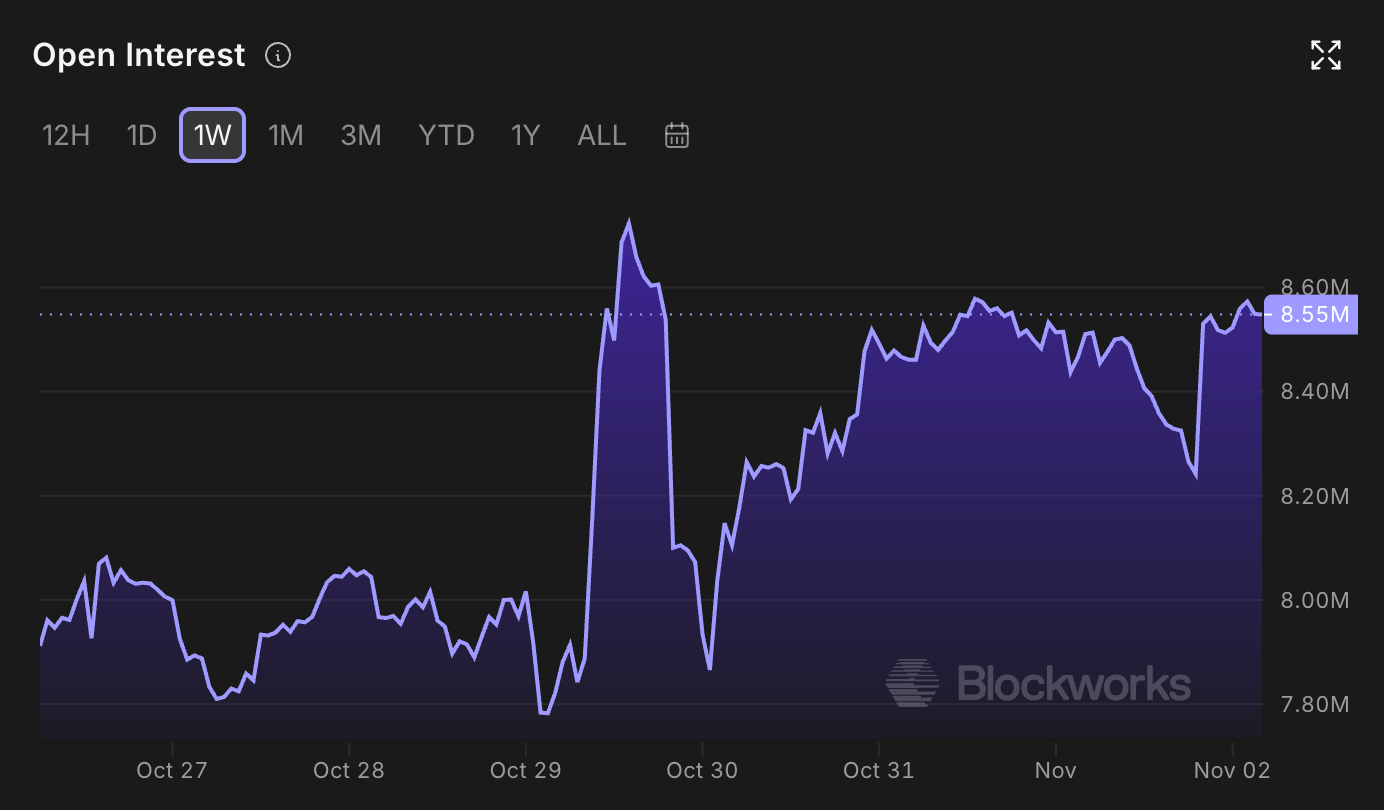
Pi Network derivatives show signs of renewed trader interest, with fresh positions building up, despite weak broader market demand. Blockworks data shows the PI futures Open Interest (OI) is at $8.55 million, up from $7.91 million last week, indicating increased notional value of active contracts. The rise in PI futures OI reflects traders' anticipation of further upside in the spot price, potentially leading to a breakout rally.
On the other hand, CoinMarketCap’s Fear and Greed Index is at 36 in the “Fear” zone, suggesting weak investor sentiment following the recent Binance hack, which stole $6 billion and briefly pushed Bitcoin (BTC) below $77,000 last week.
Technical outlook: Will PI token start a breakout rally?
Pi Network trades at $0.0784 at press time, capped beneath a long-term resistance trendline, connecting the June 20 and September 30 highs, around $0.0788. PI also trades below both the 50-day Exponential Moving Averages (EMAs) at $0.0828 and $0.1114, respectively.
Momentum shows signs of recovery on the daily chart, with the Moving Average Convergence Divergence (MACD) crossing above its signal line in negative territory, while the Relative Strength Index (RSI) at 45 rises from the oversold boundary toward the neutral midline.
A confirmed breakout above the resistance trendline at $0.0788 could confirm a bullish trend reversal, potentially targeting the 50-day EMA at $0.0828 and the 50% retracement level of the downswing from $0.1394 to $0.0704, at $0.1049.
Looking down, the only notable structural support is around the October 15 low at $0.0740, followed by the Fibonacci anchor near $0.0704, where buyers would be expected to defend the lower end of the current range if selling pressure resumes.
(The technical analysis of this story was written with the help of an AI tool. Know more.)
Үздік мақалалар
1Canadian Dollar sits near September 16 highs as weaker USD offsets declining oil prices2British Pound trades positive at the start of the BoE’s policy week3Swiss Franc remains stronger following SVME PMI data4CEE FX: Dovish stance and energy shock pressure currencies – ING5Australian Dollar dips further amid mixed data with RBA decision in focus6Polish Zloty: Inflation dip seen delaying tightening – Commerzbank7Silver Price Forecast: XAG/USD recovers strongly as oil prices hit hardly8Equities: US Tech seen rebounding after selloff – Deutsche Bank9Iran’s Baghaei: Chances of US-Iran diplomacy in next few days exits

Бастау!
Тіркеліп, 3 минуттан аз уақытта жаһандық нарықтарға қол жеткізіңіз

Бізбен байланысыңыз









Байланыстар
Телефон: +61 2 8036 8388
Факс: +61 2 8036 8388
Эл. пошта: support@tmgm.com



Осы веб-сайтта берілген ақпарат тек жалпы сипатта ғана ұсынылады және жеке қаржылық кеңес болып табылмайды. Осы веб-сайттағы кез келген ақпаратқа сүйенбес бұрын, оның сіздің мақсаттарыңызға, қаржылық жағдайыңызға және қажеттіліктеріңізге сәйкестігін бағалауыңыз керек. CFD және FX Margin Contracts-қа инвестиция салу елеулі тәуекелдермен байланысты және барлық инвесторлар үшін қолайлы емес. Сіз бастапқы салымыңыздан артық қаражат жоғалтуыңыз мүмкін. Сіз базалық активке ешқандай меншік құқығына немесе үлеске ие болмайсыз. Сауда жасамас бұрын тәуелсіз кеңес алуды және тәуекелдерді толық түсінуді ұсынамыз. Веб-сайтта көрсетілген кез келген өнімді сатып алмас бұрын, ақпараттық құжатты оқып, оны мұқият қарастыру маңызды. Осы веб-сайтта ұсынылған ақпарат пен жарнамалар жергілікті заңдар мен ережелерге қайшы келетін кез келген елде немесе юрисдикцияда тұратын адамдардың пайдалануына арналмаған. Осы веб-сайтта ұсынылатын Өнімдер мен Қызметтер Америка Құрама Штаттары, Малайзия және Таиланд тұрғындарына арналмаған.
TMGM әртүрлі юрисдикцияларда уәкілетті және реттеледі.
Trademax Australia Limited, TMGM атауымен жұмыс істейді, Австралияның Бағалы қағаздар және инвестициялар жөніндегі комиссиясымен (ASIC) реттеледі, AFSL № 436416 және мына мекенжайда орналасқан: Level 28, One International Tower, 100 Barangaroo Avenue, 2000 Sydney, NSW Australia.
Электрондық пошта: support@tmgm.com.au
Trademax Global Limited, TMGM атауымен жұмыс істейді, Вануату Қаржылық қызметтер комиссиясымен (VFSC) уәкілетті және реттеледі, тіркеу нөмірі 40356, тіркелген мекенжайы: 1276, Kumul Highway, Port Vila, Vanuatu, Republic of Vanuatu.
Электрондық пошта: support@tmgm.com
Trademax Global Markets (SE) Limited, TMGM атауымен жұмыс істейді, Сейшел аралдарының Қаржылық қызметтер басқармасы (FSA) тарапынан уәкілетті және реттеледі, лицензия нөмірі SD224. Компания мына мекенжайда тіркелген: Office No 13, Providence Estate ABIS Centre, Mahe, Seychelles.
Электрондық пошта: support@tmgm.com
Trademax Global Markets (International) Pty Ltd, TMGM атауымен жұмыс істейді, Mauritius Қаржылық қызметтер комиссиясымен (FSC) № GB22201012 лицензиясы бойынша уәкілетті және реттеледі, тіркелген мекенжайы: 33, Edith Cavell Street C/o IQ EQ Fund Services (Mauritius) Ltd Port Louis, 11324 Mauritius.
Электрондық пошта: support@tmgm.com
Авторлық құқық © TMGM. Барлық құқықтар қорғалған