

Сауда
Бәсекеге қабілетті бағалар, жоғары өтімділік және озық сауда құралдары арқылы нарықтардың кең ауқымын зерттеңіз.
Толығырақ 
Платформа
TMGM-нің жылдамдыққа, дәлдікке және жоғары деңгейлі сауда тәжірибесіне арналған қуатты платформасымен сауданы кедергісіз жүргізіңіз.
Толығырақ Сауда платформасы
Академия
Бастауыштарға арналған нұсқаулықтар, вебинарлар және нарық талдаулары сияқты ресурстар арқылы сауданың негіздерін үйреніңіз.
Толығырақ TMGM Академиясы
Жаңалықтар және талдау
Сауда мүмкіндіктерінен алда болу үшін нақты уақыттағы нарық жаңартулары мен сараптамалық талдауды алыңыз
Толығырақ Жаңалықтар және талдау
Туралы
TMGM-ді ерекшелендіретін жайттарды біліңіз — біздің жаһандық ауқымымыз, реттеушілік беріктігіміз және трейдингтегі инновацияларға деген адалдығымыз.
Толығырақ Неліктен TMGM-ді таңдау керек
Top Altcoins Price Forecast: Ripple and Solana under pressure as Hyperliquid recovers
- Ripple is down over 2% on Thursday, extending losses below $1.30 and capped below crucial moving averages.
- Solana drops 2% so far, testing its 200-day EMA and the $100 psychological level amid mounting selling pressure.
- Hyperliquid is up 7%, reclaiming its 50-day EMA at $81.21, suggesting renewed bullish momentum.
Institutional demand shakes
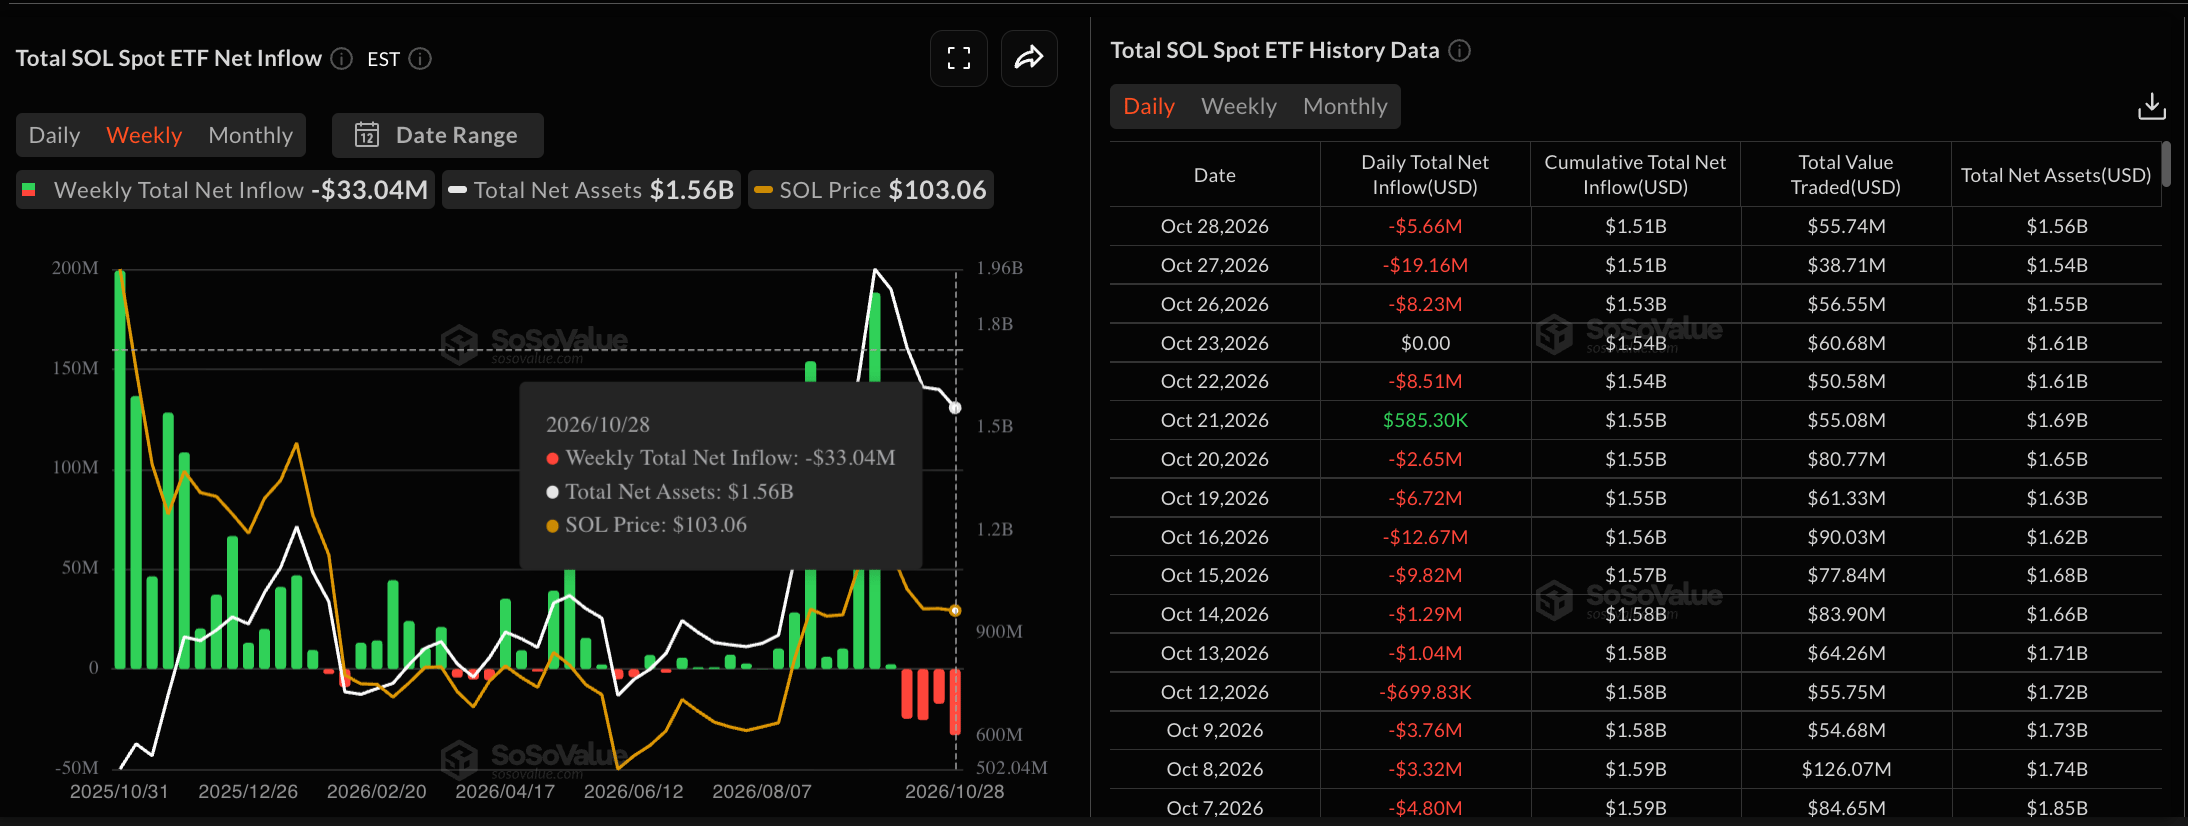
Institutional demand for altcoins is weak in the near term. Solana-focused ETFs record $5.66 million in outflows on Wednesday, after over $19 million and $8 million in outflows earlier this week, bringing the total to $33.04 million. A negative close to this week would mark its fourth consecutive weekly outflow, suggesting intense selling pressure from institutional investors.

Meanwhile, XRP and HYPE are facing institutional silence, with zero inflows on Wednesday, with weekly outflows of $3.61 million and $4.30 million, respectively.

Ripple risks breaking the key support floor
Ripple trades at $1.2924 at press time on Thursday, keeping a bearish near-term tone. XRP sits well below the 50-day and 200-day Exponential Moving Averages (EMAs) at $1.3574 and $1.3891, respectively.
The price has also retreated beneath the downward trendline barrier at $1.3216, suggesting that recent attempts to reclaim the resistance have failed.
Momentum is weak rather than washed out, with the Relative Strength Index (RSI) hovering near 40 on the daily chart, while the Moving Average Convergence Divergence (MACD) is flat in negative territory, hinting that any recovery could remain constrained.
A confirmed breakout below the $1.2588 level, set by the August 21 low, could extend the decline toward the August 2 high around $1.0933.
On the topside, initial resistance appears at the trendline break zone around $1.3216, followed by the 50-day EMA at $1.3574 and the denser structural cap provided by the 200-day EMA at $1.3891.
Solana tests the 200-day EMA support
Solana hovers around $100 on Thursday, keeping a bearish near-term bias. The SOL price remains below the 50-day EMA at $105 while holding above the longer-term 200-day EMA at $98.36.
The RSI around 35 hovers just above oversold territory, and the MACD stays negative, together suggesting waning but still dominant downside momentum.
A sustained close below the 200-day EMA at $98.36 could result in another test of the rising support trendline near $87.26.
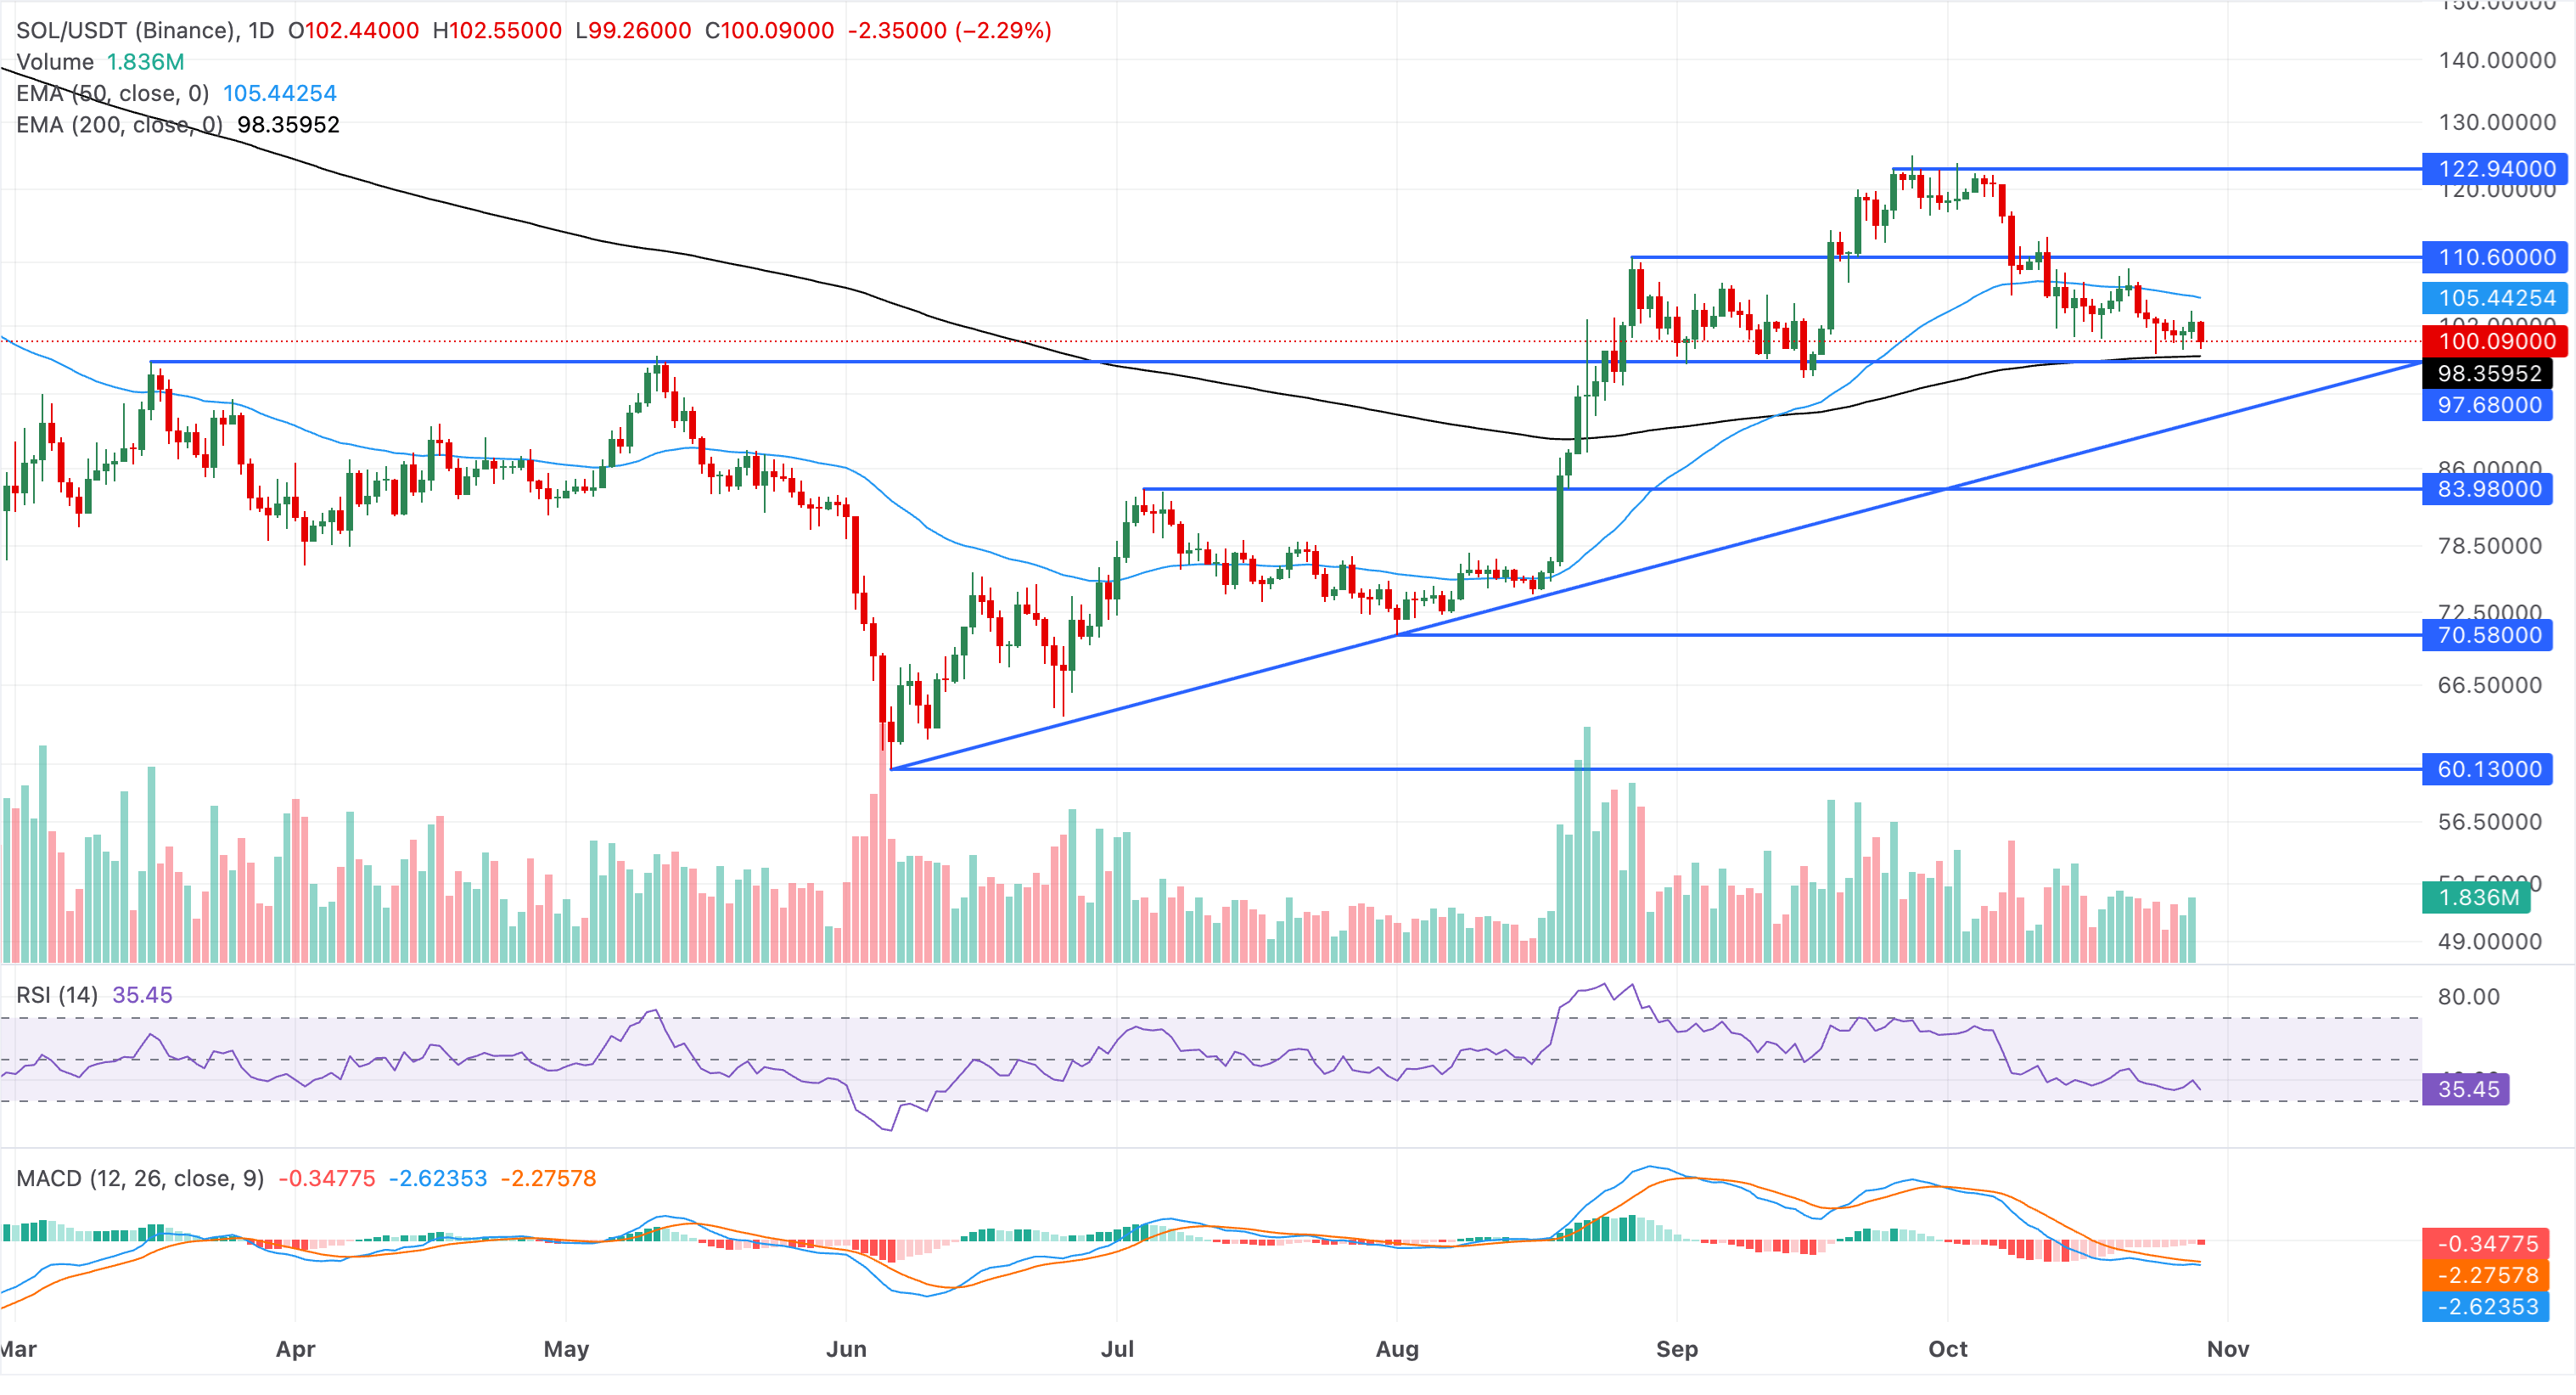
Immediate resistance is located at the 50-day EMA near $105.44, which caps recovery attempts and would need to be reclaimed to open a more constructive bullish phase.
Hyperliquid capped below 50-day EMA
Hyperliquid hovers above $86.00 on Thursday, maintaining a bullish near-term bias. HYPE holds well above the 50-day EMA at $81.82 and the 200-day EMA at $67.77, keeping the broader uptrend intact despite recent volatility.
Momentum conditions are constructive, with the RSI near 59 and the MACD in positive territory, hinting that buyers remain in control.
The immediate resistance for HYPE aligns with the September 3 high around $88.14, which could open the path toward the September 23 high around $98.30 and the $100 psychological threshold.
On the downside, immediate support is defined by the 50-day EMA near $81.82. Below that, the longer-term bullish structure is supported by the rising trendline around $76.07 and the 200-day EMA at $67.77, with deeper pullbacks expected to attract dip-buying interest.
(The technical analysis of this story was written with the help of an AI tool. Know more.)
Үздік мақалалар
1Euro: ECB guidance could keep range intact against US Dollar – DBS2$52.34: Silver hits fresh yearly lows amid hopes of further Fed tightening 3British Pound: Short-term downside bias toward 1.3265 against US Dollar – UOB4Canadian Dollar: Oil risks bolster case for further BoC hike – Commerzbank5US Initial Jobless Claims dropped to 194K last week6United States economy grows 3.4% in third quarter vs. 3.2% expected7Japanese Yen weakens against Pound Sterling as BoJ decision looms8Pound Sterling Price News and Forecast: GBP/USD ticks lower as the US Dollar regains ground9Euro: Downside risks persist against US Dollar - Societe Generale


Бастау!
Тіркеліп, 3 минуттан аз уақытта жаһандық нарықтарға қол жеткізіңіз

Бізбен байланысыңыз









Байланыстар
Телефон: +61 2 8036 8388
Факс: +61 2 8036 8388
Эл. пошта: support@tmgm.com



Осы веб-сайтта берілген ақпарат тек жалпы сипатта ғана ұсынылады және жеке қаржылық кеңес болып табылмайды. Осы веб-сайттағы кез келген ақпаратқа сүйенбес бұрын, оның сіздің мақсаттарыңызға, қаржылық жағдайыңызға және қажеттіліктеріңізге сәйкестігін бағалауыңыз керек. CFD және FX Margin Contracts-қа инвестиция салу елеулі тәуекелдермен байланысты және барлық инвесторлар үшін қолайлы емес. Сіз бастапқы салымыңыздан артық қаражат жоғалтуыңыз мүмкін. Сіз базалық активке ешқандай меншік құқығына немесе үлеске ие болмайсыз. Сауда жасамас бұрын тәуелсіз кеңес алуды және тәуекелдерді толық түсінуді ұсынамыз. Веб-сайтта көрсетілген кез келген өнімді сатып алмас бұрын, ақпараттық құжатты оқып, оны мұқият қарастыру маңызды. Осы веб-сайтта ұсынылған ақпарат пен жарнамалар жергілікті заңдар мен ережелерге қайшы келетін кез келген елде немесе юрисдикцияда тұратын адамдардың пайдалануына арналмаған. Осы веб-сайтта ұсынылатын Өнімдер мен Қызметтер Америка Құрама Штаттары, Малайзия және Таиланд тұрғындарына арналмаған.
TMGM әртүрлі юрисдикцияларда уәкілетті және реттеледі.
Trademax Australia Limited, TMGM атауымен жұмыс істейді, Австралияның Бағалы қағаздар және инвестициялар жөніндегі комиссиясымен (ASIC) реттеледі, AFSL № 436416 және мына мекенжайда орналасқан: Level 28, One International Tower, 100 Barangaroo Avenue, 2000 Sydney, NSW Australia.
Электрондық пошта: support@tmgm.com.au
Trademax Global Limited, TMGM атауымен жұмыс істейді, Вануату Қаржылық қызметтер комиссиясымен (VFSC) уәкілетті және реттеледі, тіркеу нөмірі 40356, тіркелген мекенжайы: 1276, Kumul Highway, Port Vila, Vanuatu, Republic of Vanuatu.
Электрондық пошта: support@tmgm.com
Trademax Global Markets (SE) Limited, TMGM атауымен жұмыс істейді, Сейшел аралдарының Қаржылық қызметтер басқармасы (FSA) тарапынан уәкілетті және реттеледі, лицензия нөмірі SD224. Компания мына мекенжайда тіркелген: Office No 13, Providence Estate ABIS Centre, Mahe, Seychelles.
Электрондық пошта: support@tmgm.com
Trademax Global Markets (International) Pty Ltd, TMGM атауымен жұмыс істейді, Mauritius Қаржылық қызметтер комиссиясымен (FSC) № GB22201012 лицензиясы бойынша уәкілетті және реттеледі, тіркелген мекенжайы: 33, Edith Cavell Street C/o IQ EQ Fund Services (Mauritius) Ltd Port Louis, 11324 Mauritius.
Электрондық пошта: support@tmgm.com
Авторлық құқық © TMGM. Барлық құқықтар қорғалған