


EUR/CHF Price Forecast: 100-day SMA limits immediate downside
- EUR/CHF trades on the back foot as France’s fiscal troubles weigh on the Euro.
- The cross trades below the 50-day SMA, while the 100-day SMA near 0.9297 offers initial support.
- A bearish MACD crossover and RSI near 36 point to growing selling pressure.
EUR/CHF holds modest losses on Monday as growing fiscal concerns in France weigh on the Euro (EUR). However, the cross has reversed most of its intraday decline as buying interest in the Swiss Franc (CHF) remains limited due to Switzerland’s wide interest-rate gap with other major economies and the Swiss National Bank’s (SNB) readiness to counter excessive Franc strength. At the time of writing, EUR/CHF trades around 0.9318 after hitting an intraday low of 0.9272.

Euro pressured as France fiscal strains complicate ECB backstop
Strategists at Brown Brothers Harriman note that the Euro is lagging its peers, with “EUR is underperforming all major currencies, with EUR/USD dropping briefly to an intra-day low at 1.1161, its lowest level since May 2025.” They highlight that “France’s budget crisis is spilling into other Eurozone sovereign bond markets, widening yield spreads to Germany,” amplifying concerns around fiscal risk across the bloc.
BBH points out that the ECB’s Transmission Protection Instrument “provides a backstop against disorderly spread widening, but activation is contingent on EU member state pursuing ‘sound and sustainable fiscal and macroeconomic policies.’” In their view, “France's deteriorating finances complicate the case for intervention, although broader contagion would increase pressure on the ECB to act.”
At the same time, BBH notes that ECB Chief Economist Philip Lane has underlined that the “increase in long-term interest rates constitutes a material tightening of financial conditions for the euro area.” Taken together, they argue this leaves the Euro “facing downside pressure from both rising fiscal risk and a potentially shallower ECB hiking cycle.”
Technical analysis
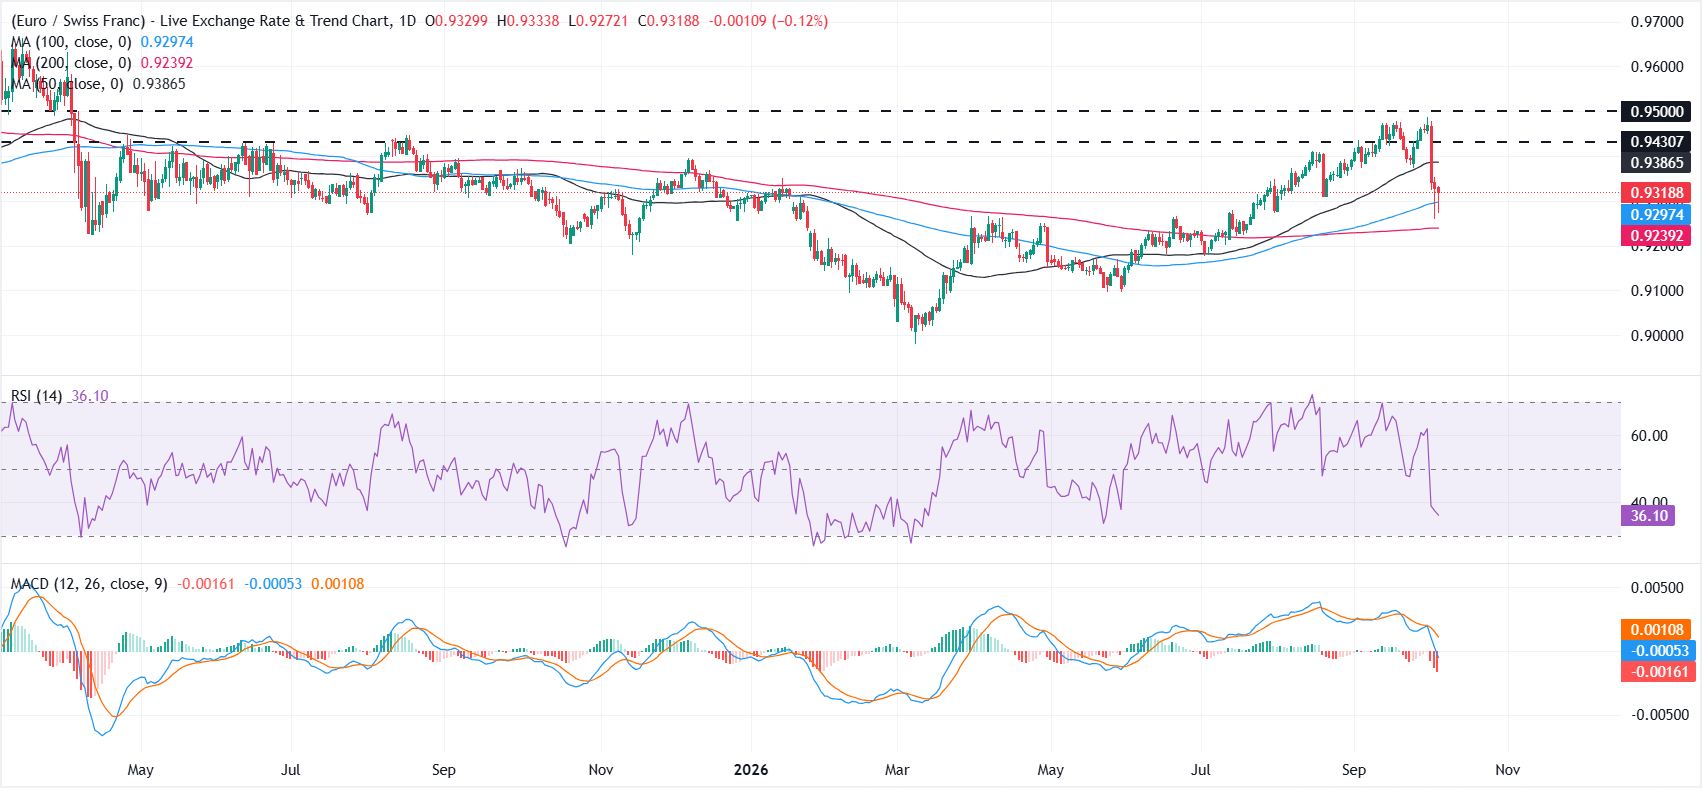
The daily chart shows EUR/CHF under renewed selling pressure after a sharp rejection from the 0.9480 area. The cross has fallen below the 50-day Simple Moving Average (SMA) at 0.9387, weakening the near-term picture. However, it remains above the 100-day SMA at 0.9297 and the 200-day SMA at 0.9239, keeping the broader structure relatively supported.
Momentum indicators lean bearish. The Relative Strength Index (RSI) has dropped to around 36, reflecting growing selling pressure but remaining above oversold territory. The Moving Average Convergence Divergence (MACD) line has crossed below the signal line, while the histogram has moved deeper into negative territory.
On the downside, the 100-day SMA near 0.9297 offers initial support, followed by Monday’s low around 0.9272. A clear break below this area could expose the 200-day SMA at 0.9239. On the topside, the 50-day SMA at 0.9387 acts as immediate resistance, followed by 0.9430. A sustained move above this level could open the door towards the 0.9500 psychological mark.
Euro Price Today
The table below shows the percentage change of Euro (EUR) against listed major currencies today. Euro was the strongest against the New Zealand Dollar.
| USD | EUR | GBP | JPY | CAD | AUD | NZD | CHF | |
|---|---|---|---|---|---|---|---|---|
| USD | 0.45% | 0.23% | 0.11% | 0.02% | -0.30% | 0.50% | 0.34% | |
| EUR | -0.45% | -0.17% | -0.30% | -0.37% | -0.56% | -0.01% | -0.07% | |
| GBP | -0.23% | 0.17% | -0.13% | -0.21% | -0.38% | 0.15% | 0.11% | |
| JPY | -0.11% | 0.30% | 0.13% | -0.10% | -0.32% | 0.29% | 0.23% | |
| CAD | -0.02% | 0.37% | 0.21% | 0.10% | -0.21% | 0.37% | 0.31% | |
| AUD | 0.30% | 0.56% | 0.38% | 0.32% | 0.21% | 0.55% | 0.50% | |
| NZD | -0.50% | 0.01% | -0.15% | -0.29% | -0.37% | -0.55% | -0.06% | |
| CHF | -0.34% | 0.07% | -0.11% | -0.23% | -0.31% | -0.50% | 0.06% |
The heat map shows percentage changes of major currencies against each other. The base currency is picked from the left column, while the quote currency is picked from the top row. For example, if you pick the Euro from the left column and move along the horizontal line to the US Dollar, the percentage change displayed in the box will represent EUR (base)/USD (quote).
인기 기사
1Cryptocurrencies price prediction: XRP, Bitcoin & Cryptos – American Wrap 05 October2Bitcoin and Gold Outlook: BTC slips, XAU downtrend persists as US Services PMI misses forecasts3British Pound slides as France fiscal shock lifts the US Dollar4EUR/CHF Price Forecast: 100-day SMA limits immediate downside5Australian Dollar edges higher even as robust US services, firm Dollar cap gains6Euro: Fiscal stress and fewer ECB hikes weigh against US Dollar – BBH7Dollar Index hits an 18-month high on French debt fears8Canadian Dollar attracts fresh buying after touching multi-month low9South Korean Won: Strong exports and policy support KRW – Commerzbank
실시간 시세

TECHNICAL에 대한 모든 것
ICT 트레이딩이란 무엇인가요? 이너 서클 트레이더(Inner Circle Trader) 개념 설명
지지선과 저항선: 의미, 유형, 레벨을 그리는 방법 및 트레이딩 전략
유동성이란 무엇인가요? 트레이딩 및 금융시장에서의 의미
유동성 스윕: 의미, 예시 및 트레이딩 전략
트레이딩의 시장 구조: 완벽 가이드 (상승장, 하락장, 횡보장)
캐릭터 변화 (CHoCH): 정의, 예시 및 전략
다크 클라우드 커버 패턴이란 무엇이며, 이를 어떻게 트레이딩하나요?
피어싱 라인 캔들스틱 패턴이란 무엇이며, 이를 어떻게 트레이딩하나요?
트위저 탑 및 바닥 캔들스틱 패턴이란 무엇인가요?

소셜 미디어












이 웹사이트에 제공된 정보는 일반적인 성격의 정보일 뿐이며 개인 맞춤형 금융 자문을 구성하지 않습니다. 이 웹사이트의 정보를 바탕으로 행동하기 전에, 귀하의 목표, 재정 상황 및 필요에 비추어 해당 정보의 적합성을 고려해야 합니다. CFD 및 FX 마진 계약에 대한 투자는 상당한 위험을 수반하며 모든 투자자에게 적합하지 않을 수 있습니다. 귀하는 최초 예치금보다 더 큰 손실을 입을 수 있습니다. 귀하는 기초자산에 대한 소유권이나 어떠한 이해관계도 보유하지 않습니다. 거래를 시작하기 전에 독립적인 자문을 구하고 관련 위험을 충분히 이해하시기를 권장합니다. 웹사이트에 기재된 상품을 취득하기 전에 공시 문서를 읽고 검토하는 것이 중요합니다. 이 웹사이트에서 제공되는 정보 및 광고는 그러한 사용이 현지 법률 및 규정에 위배되는 국가 또는 관할권의 개인이 사용하도록 의도된 것이 아닙니다. 이 웹사이트에서 제공되는 상품 및 서비스는 미국, 말레이시아 및 태국 거주자를 대상으로 하지 않습니다.
TMGM은 다양한 관할권에서 승인 및 규제를 받고 있습니다.
TMGM으로 거래하는 Trademax Australia Limited는 호주 증권투자위원회(ASIC)의 규제를 받으며, AFSL 번호 436416이고 Level 28, One International Tower, 100 Barangaroo Avenue, 2000 Sydney, NSW Australia에 위치하고 있습니다.
이메일: support@tmgm.com.au
TMGM으로 거래하는 Trademax Global Limited는 바누아투 금융서비스위원회(VFSC)의 승인 및 규제를 받으며, 등록 번호 40356이고 1276, Kumul Highway, Port Vila, Vanuatu, Republic of Vanuatu에 등록되어 있습니다.
이메일: support@tmgm.com
Trademax Global Markets (SE) Limited(이하 TMGM)는 세이셸 금융청(FSA)의 인가 및 규제를 받으며, 허가 번호는 SD224입니다. 회사는 세이셸 마헤, 프로비던스 에스테이트 ABIS 센터, 사무실 번호 13에 등록되어 있습니다.
이메일: support@tmgm.com
TMGM으로 거래하는 Trademax Global Markets (International) Pty Ltd는 모리셔스 금융서비스위원회(FSC)의 승인 및 규제를 받으며 라이선스 번호 GB22201012이고, 33, Edith Cavell Street C/o IQ EQ Fund Services (Mauritius) Ltd Port Louis, 11324 Mauritius에 등록되어 있습니다.
이메일: support@tmgm.com
Copyright © TMGM. All rights reserved