


Top 3 Price Predictions: Bitcoin, Ethereum, Ripple – BTC eyes $85,000, ETH holds support, XRP stabilizes
- Bitcoin extends its rebound, trading above $83,400 on Wednesday and heading toward $85,000 resistance.
- Ethereum trades above the 50-day EMA around $2,501 after finding support around $2,400.
- XRP is around $1.37, hovering around the key EMA cluster.
Bitcoin (BTC), Ethereum (ETH), and Ripple (XRP) show signs of recovery on Wednesday as buyers try to regain control after their recent market weakness. BTC extends its rebound toward the $85,000 resistance, while ETH and XRP find support around key levels.
Bitcoin holds above key EMA supports

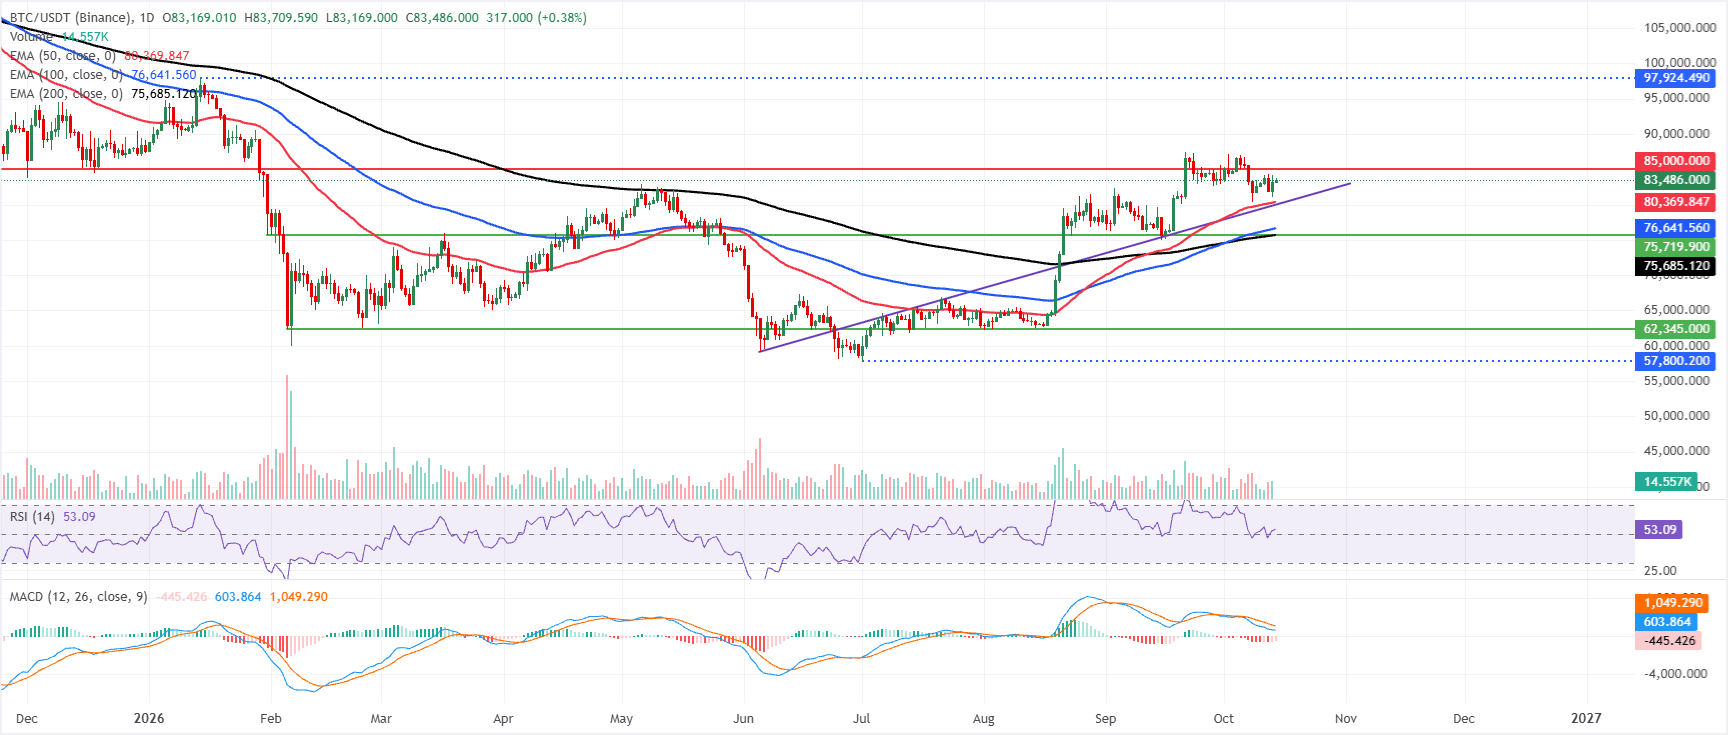
Bitcoin price trades at $83,480 on Wednesday, maintaining a bullish bias as it stays above the 50-day, 100-day, and 200-day Exponential Moving Averages (EMAs) at $80,369, $76,641, and $75,685, respectively.
The clustering of these EMAs below price suggests a well-supported uptrend, even as the latest Relative Strength Index (RSI) reading around 53 keeps momentum in a neutral-to-positive zone. The Moving Average Convergence Divergence (MACD) indicator stays below zero, with a negative line at -445.81, suggesting bullish pressure is moderating after the recent rally rather than accelerating strongly.
On the topside, immediate resistance is defined by the horizontal barrier at $85,000, where a sustained break would likely open the way to fresh highs.
On the downside, initial support emerges near the 50-day EMA at $80,369, followed by the 100-day EMA at $76,641 and the 200-day EMA at $75,685, levels that should attract buyers on corrective dips as long as the broader bullish structure persists.
Ethereum rebounds after finding support around the $2,400 mark
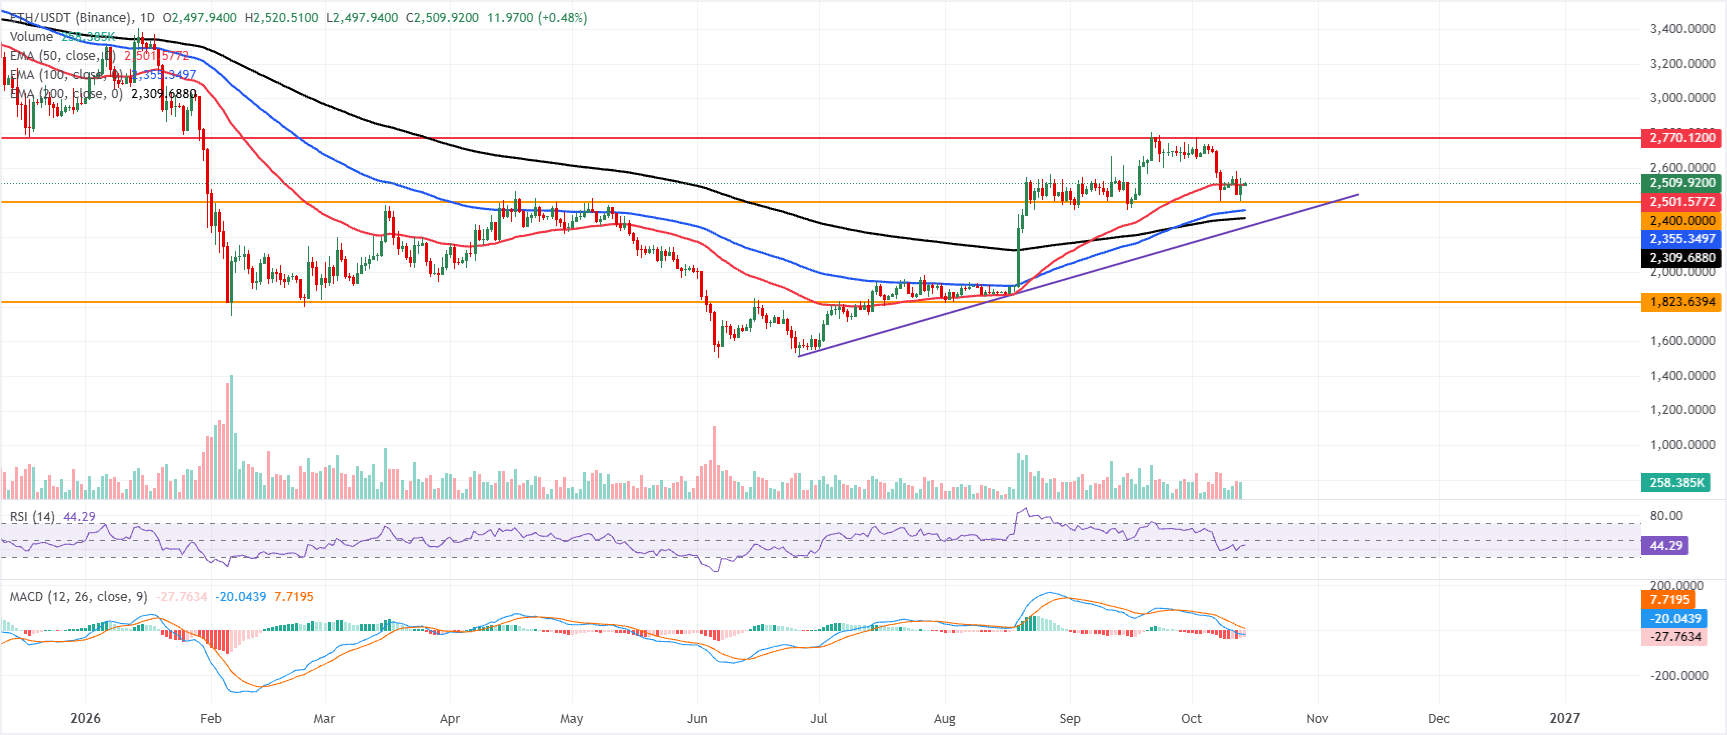
Ethereum price trades at $2,509 on Wednesday, holding above its key EMAs and former trendline support, which keeps the near-term bias constructive. The 50-day EMA at $2,501 sits just beneath spot, reinforcing immediate underlying demand alongside the 100-day EMA at $2,355 and the 200-day EMA at $2,309.
However, momentum is subdued, with the RSI hovering near a neutral 44 and the MACD indicator well below zero, suggesting upside traction is fragile despite the supportive structure.
On the downside, initial support is located at the 50-day EMA around $2,501, followed by a short-term horizontal floor near $2,400 and the broken but still relevant rising trendline level around $2,256, before a more distant structural base emerges at $1,823.
On the topside, the next notable resistance is seen at the horizontal barrier around $2,770, where buyers would need to overcome overhead supply to extend the recovery; failure to do so would keep ETH consolidating above its cluster of daily EMAs rather than staging a clearer bullish continuation.
XRP stabilizes around key EMA clusters
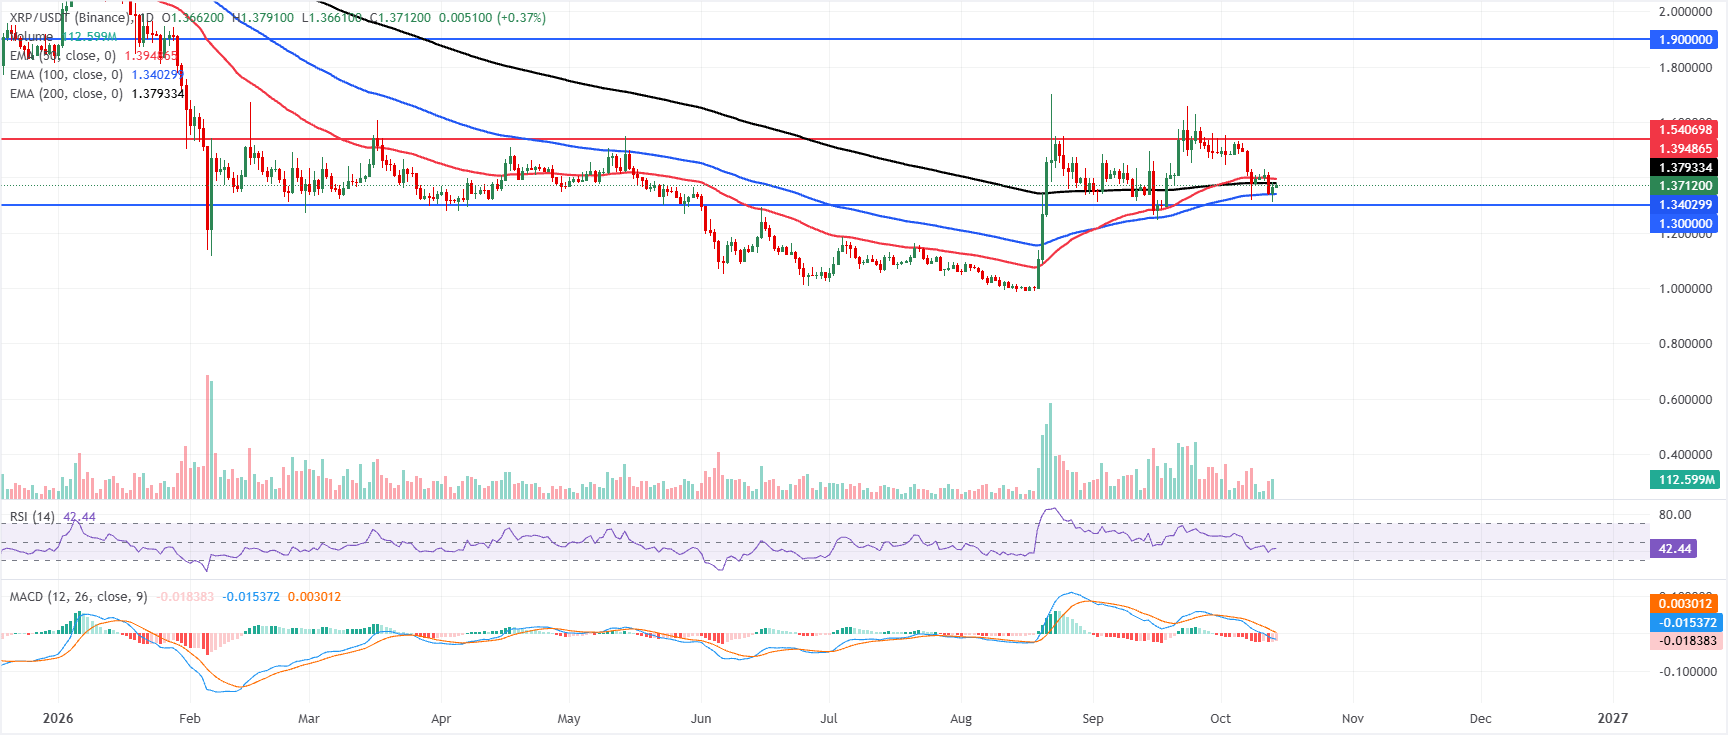
XRP price trades at $1.371 on Wednesday, holding below the 200-day EMA at $1.379 and the 50-day EMA at $1.394, which keeps the near-term bias bearish despite the pair sitting above the 100-day EMA at $1.340.
The RSI at 42 leans soft but not oversold, while the MACD remains below zero, suggesting downside pressure still outweighs recovery attempts.
On the topside, initial resistance is seen at the 200-day EMA at $1.379, followed by the 50-day EMA at $1.394; a sustained break above these clustered averages would open the way toward the horizontal barrier at $1.540 and then $1.900.
On the downside, immediate support is defined by the 100-day EMA at $1.340, ahead of the horizontal floor at $1.300, where a decisive drop would reinforce the bearish tone and expose deeper retracement levels.
(The technical analysis of this story was written with the help of an AI tool. Know more.)
Cryptocurrency metrics FAQs
The developer or creator of each cryptocurrency decides on the total number of tokens that can be minted or issued. Only a certain number of these assets can be minted by mining, staking or other mechanisms. This is defined by the algorithm of the underlying blockchain technology. On the other hand, circulating supply can also be decreased via actions such as burning tokens, or mistakenly sending assets to addresses of other incompatible blockchains.
Market capitalization is the result of multiplying the circulating supply of a certain asset by the asset’s current market value.
Trading volume refers to the total number of tokens for a specific asset that has been transacted or exchanged between buyers and sellers within set trading hours, for example, 24 hours. It is used to gauge market sentiment, this metric combines all volumes on centralized exchanges and decentralized exchanges. Increasing trading volume often denotes the demand for a certain asset as more people are buying and selling the cryptocurrency.
Funding rates are a concept designed to encourage traders to take positions and ensure perpetual contract prices match spot markets. It defines a mechanism by exchanges to ensure that future prices and index prices periodic payments regularly converge. When the funding rate is positive, the price of the perpetual contract is higher than the mark price. This means traders who are bullish and have opened long positions pay traders who are in short positions. On the other hand, a negative funding rate means perpetual prices are below the mark price, and hence traders with short positions pay traders who have opened long positions.
인기 기사
1Swiss Franc strengthens as US Dollar slips on dovish Fed signals2WTI Price Forecast: Eases from two-week high; trades below $94.00 amid bullish setup3EUR/JPY Price Forecast: Gains ground below 177.50, but stays bearish below 100-day SMA4India Gold price today: Gold steadies, according to FXStreet data5Zcash Price Forecast: ZEC poised for a rebound as momentum recovers6UK Finance Minister Healey to fund budget giveaways without extra borrowing — FT7GBP/USD Price Forecast: Hits one-week top as bulls eye range breakout above 1.33008Top 3 Price Predictions: Bitcoin, Ethereum, Ripple – BTC eyes $85,000, ETH holds support, XRP stabilizes9Gold draws support from retreating USD; holds above $4,150 as traders await US CPI report
실시간 시세

TECHNICAL에 대한 모든 것
트레이딩 백테스팅: 백테스팅이란 무엇이며 전략을 어떻게 백테스트하는가
ICT 트레이딩이란 무엇인가요? 이너 서클 트레이더(Inner Circle Trader) 개념 설명
지지선과 저항선: 의미, 유형, 레벨을 그리는 방법 및 트레이딩 전략
유동성이란 무엇인가요? 트레이딩 및 금융시장에서의 의미
유동성 스윕: 의미, 예시 및 트레이딩 전략
트레이딩의 시장 구조: 완벽 가이드 (상승장, 하락장, 횡보장)
캐릭터 변화 (CHoCH): 정의, 예시 및 전략
강세 키커 패턴이란 무엇이며, 어떻게 트레이딩에 활용할 수 있을까요?
역망치형 캔들스틱 패턴이란 무엇이며, 이를 어떻게 트레이딩하나요?

소셜 미디어












이 웹사이트에 제공된 정보는 일반적인 성격의 정보일 뿐이며 개인 맞춤형 금융 자문을 구성하지 않습니다. 이 웹사이트의 정보를 바탕으로 행동하기 전에, 귀하의 목표, 재정 상황 및 필요에 비추어 해당 정보의 적합성을 고려해야 합니다. CFD 및 FX 마진 계약에 대한 투자는 상당한 위험을 수반하며 모든 투자자에게 적합하지 않을 수 있습니다. 귀하는 최초 예치금보다 더 큰 손실을 입을 수 있습니다. 귀하는 기초자산에 대한 소유권이나 어떠한 이해관계도 보유하지 않습니다. 거래를 시작하기 전에 독립적인 자문을 구하고 관련 위험을 충분히 이해하시기를 권장합니다. 웹사이트에 기재된 상품을 취득하기 전에 공시 문서를 읽고 검토하는 것이 중요합니다. 이 웹사이트에서 제공되는 정보 및 광고는 그러한 사용이 현지 법률 및 규정에 위배되는 국가 또는 관할권의 개인이 사용하도록 의도된 것이 아닙니다. 이 웹사이트에서 제공되는 상품 및 서비스는 미국, 말레이시아 및 태국 거주자를 대상으로 하지 않습니다.
TMGM은 다양한 관할권에서 승인 및 규제를 받고 있습니다.
TMGM으로 거래하는 Trademax Australia Limited는 호주 증권투자위원회(ASIC)의 규제를 받으며, AFSL 번호 436416이고 Level 28, One International Tower, 100 Barangaroo Avenue, 2000 Sydney, NSW Australia에 위치하고 있습니다.
이메일: support@tmgm.com.au
TMGM으로 거래하는 Trademax Global Limited는 바누아투 금융서비스위원회(VFSC)의 승인 및 규제를 받으며, 등록 번호 40356이고 1276, Kumul Highway, Port Vila, Vanuatu, Republic of Vanuatu에 등록되어 있습니다.
이메일: support@tmgm.com
Trademax Global Markets (SE) Limited(이하 TMGM)는 세이셸 금융청(FSA)의 인가 및 규제를 받으며, 허가 번호는 SD224입니다. 회사는 세이셸 마헤, 프로비던스 에스테이트 ABIS 센터, 사무실 번호 13에 등록되어 있습니다.
이메일: support@tmgm.com
TMGM으로 거래하는 Trademax Global Markets (International) Pty Ltd는 모리셔스 금융서비스위원회(FSC)의 승인 및 규제를 받으며 라이선스 번호 GB22201012이고, 33, Edith Cavell Street C/o IQ EQ Fund Services (Mauritius) Ltd Port Louis, 11324 Mauritius에 등록되어 있습니다.
이메일: support@tmgm.com
Copyright © TMGM. All rights reserved