

Perdagangan
Terokai pelbagai pasaran dengan harga yang kompetitif, kecairan yang mendalam, dan alat perdagangan yang canggih.
Ketahui Lebih Lanjut 
Platform
Berdagang dengan lancar menggunakan platform berkuasa TMGM, dibina untuk kelajuan, ketepatan, dan pengalaman perdagangan yang unggul.
Ketahui Lebih Lanjut Platform Perdagangan
Akademi
Pelajari asas perdagangan dengan sumber yang mesra pemula, termasuk panduan, webinar, dan wawasan pasaran.
Ketahui Lebih Lanjut Akademi TMGM
Berita & Analisis
Dapatkan kemas kini pasaran masa nyata dan analisis pakar untuk kekal mendahului peluang perdagangan
Ketahui Lebih Lanjut Berita & Analisis
Tentang
Ketahui apa yang membezakan TMGM — kehadiran global kami, kekuatan kawal selia, dan komitmen terhadap inovasi dalam perdagangan.
Ketahui Lebih Lanjut Mengapa Pilih TMGM
Bitcoin Weekly Forecast: Macroeconomic headwinds, cooling demand cap BTC gains
- Bitcoin extends its correction this week, trading below $82,500 on Friday, as selling pressure continues.
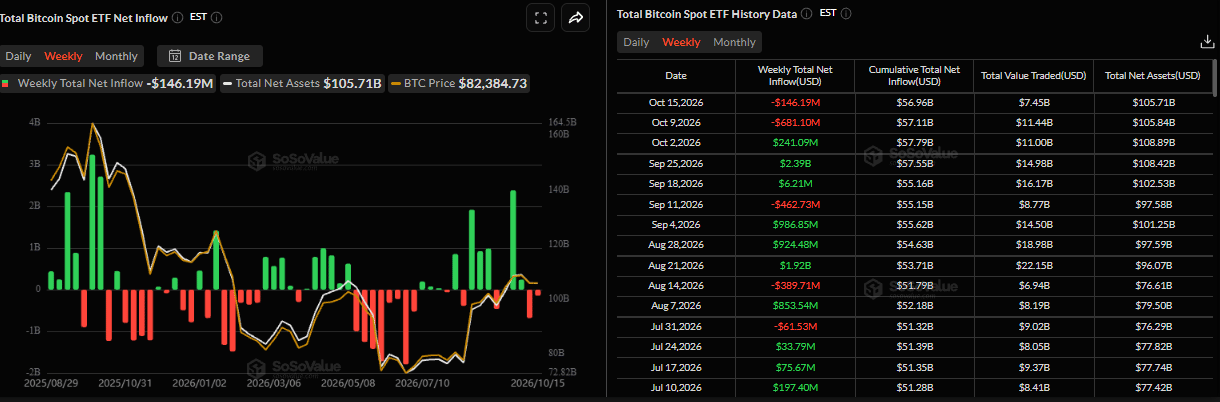
- US-listed spot ETFs are on track to record a two-week withdrawal streak, with $146.19 million in net outflows through Thursday.
- Hotter-than-expected US CPI and PPI data point to broader inflation pressures and persistent geopolitical uncertainty, weighing on risk sentiment.
Bitcoin (BTC) extends losses this week, trading below $82,500 as of Friday as selling pressure continues. Weakening institutional demand supports this pullback as BTC spot Exchange-Traded Funds (ETFs) are on track to record a two-week withdrawal streak, reaching $146.19 million in net outflows through Thursday.

Hotter-than-expected US inflation data, followed by persistent geopolitical uncertainty, weigh on risk sentiment and keep a lid on Crypto King.
Institutional buying pressure fades
Institutional demand for Bitcoin continued to weaken so far this week. SoSoValue data show spot ETFs are on track to record a two-week withdrawal streak, with $146.19 million in net outflows through Thursday. If these withdrawals continue and intensify on Friday, BTC could see further correction.
On the corporate side, Michael Saylor announced on Monday that his firm, Strategy, acquired another 250 BTC after buying 1,665 BTC previously. The company currently holds 848,250 BTC, and its total reserves are $5.5 billion in USD assets.
In addition, Strive (ASST) announced on Tuesday that it purchased an additional 3,311 BTC, bringing its digital treasury balance to 32,773 BTC.
These latest purchases suggest that corporate Bitcoin accumulation remains active, with Strategy and Strive continuing to expand their reserves despite market uncertainty. Such buying could provide some cushion if BTC prices continue to fall.
Inflation risks put a lid on BTC
On the macroeconomic side, inflation concerns continue to put pressure on risky assets. US CPI data released on Wednesday showed the annual rate at 3.7% in September, hotter than expected and up from August’s 3.4%.
Moreover, core CPI, excluding volatile food and energy prices, increased by 2.6% YoY in the same month, up from August’s 2.4% rise. Meanwhile, headline and core CPI rose 0.6% and 0.3% month-over-month, respectively.
In addition, the US PPI also advanced 1.3% MoM in September, the largest gain since March 2022, and the yearly rate soared to 6.3%. Excluding volatile food and energy components, core PPI climbed 0.7% and 5% on a monthly and yearly basis, respectively, suggesting inflationary pressures are broadening beyond energy products. These hotter figures point to persistent inflationary pressures, reaffirming market bets for further policy tightening by the Federal Reserve (Fed).
The Fed Chairman Kevin Warsh joined International Monetary Fund (IMF) Managing Director Kristalina Georgieva for a fireside chat in Bangkok, Thailand, on Friday.
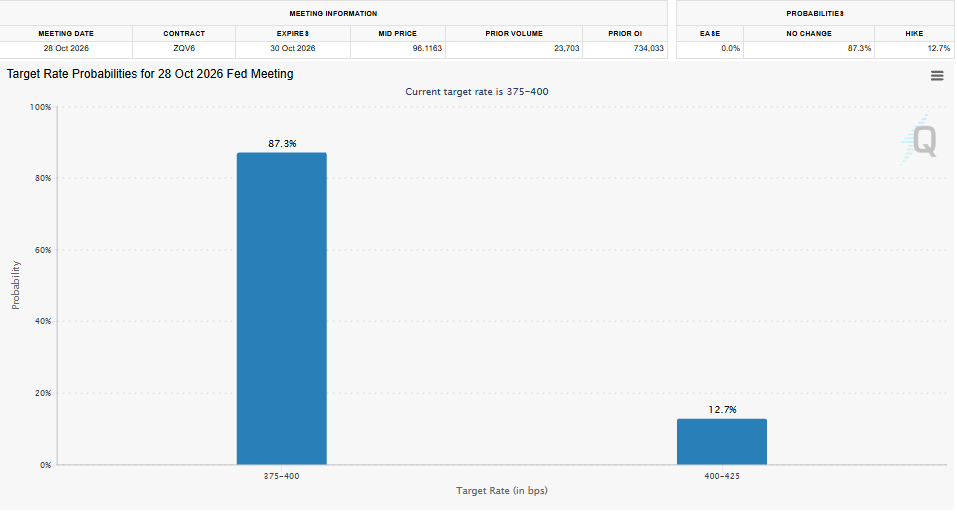
Warsh said the economy has "broadly conformed with our expectations" since the rate increase in September. Bets on a Fed rate hold in October have strengthened after his comments. The CME FedWatch Tool chart below shows that market expectations for an October rate hike have eased after Warsh’s remarks, with the implied probability falling to around 12% on Friday from 27% after Thursday’s inflation figures, providing mild support to the Crypto King.
Persistent geopolitical uncertainty continues to pressure risk sentiment
Geopolitical uncertainty and mixed signals continue to dampen risk appetite. In the latest developments, the Iran-backed Houthi group carried out a deadly missile attack targeting the presidential palace, the seat of Yemen’s Saudi-backed and internationally recognized government in the southern city of Aden.
Moreover, French Foreign Minister Pascal Confavreux confirmed that France has started deploying its military assets in Saudi Arabia.
Adding to this, the US military developed strike plans that include ‘mother of all bombs’ against Iranian energy infrastructure and nuclear sites.
These developments underscore persistent uncertainty, raise the risk of further escalation in the Middle East and therefore weigh on risk-sensitive assets such as BTC.
Some signs of optimism
Apart from these macroeconomic headwinds and cooling demand, on-chain data shows some signs of optimism for BTC.
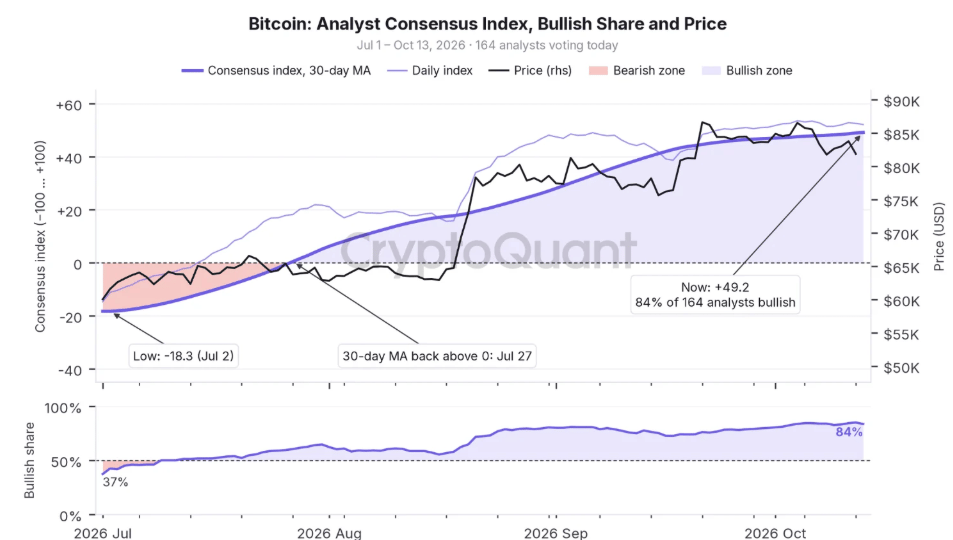
CryptoQuant’s weekly report published on Wednesday highlighted that Bitcoin’s 30-day analyst consensus index has recovered sharply, suggesting a growing bullish outlook among market participants.
As shown in the chart below, the metric bottomed at -18.3 on July 2 before crossing above zero (neutral) on July 27. It currently stands at +49.2, with 84% of the 164 analysts holding a bullish outlook. Moreover, the current recovery in sentiment is also stronger than the one observed during the 2022–2023 market cycle. In the last cycle, Bitcoin’s 30-day index never fell below −1.3 (two weeks after the $15,800 cycle low of November 21) and reached +34.2, 103 days later, on March 20, 2023, with 80% of 113 analysts bullish. This time the trough was −18.3 and the same 103 days took the index to +49.2 — a 67-point swing versus 36 — on a 33% price gain from the trough day versus 65%.
“Analysts have moved further ahead of price than they did at the start of the 2023 bull market,” CryptoQuant’s report added.
Bitcoin technical outlook: Heading $80,000 or $85,000?
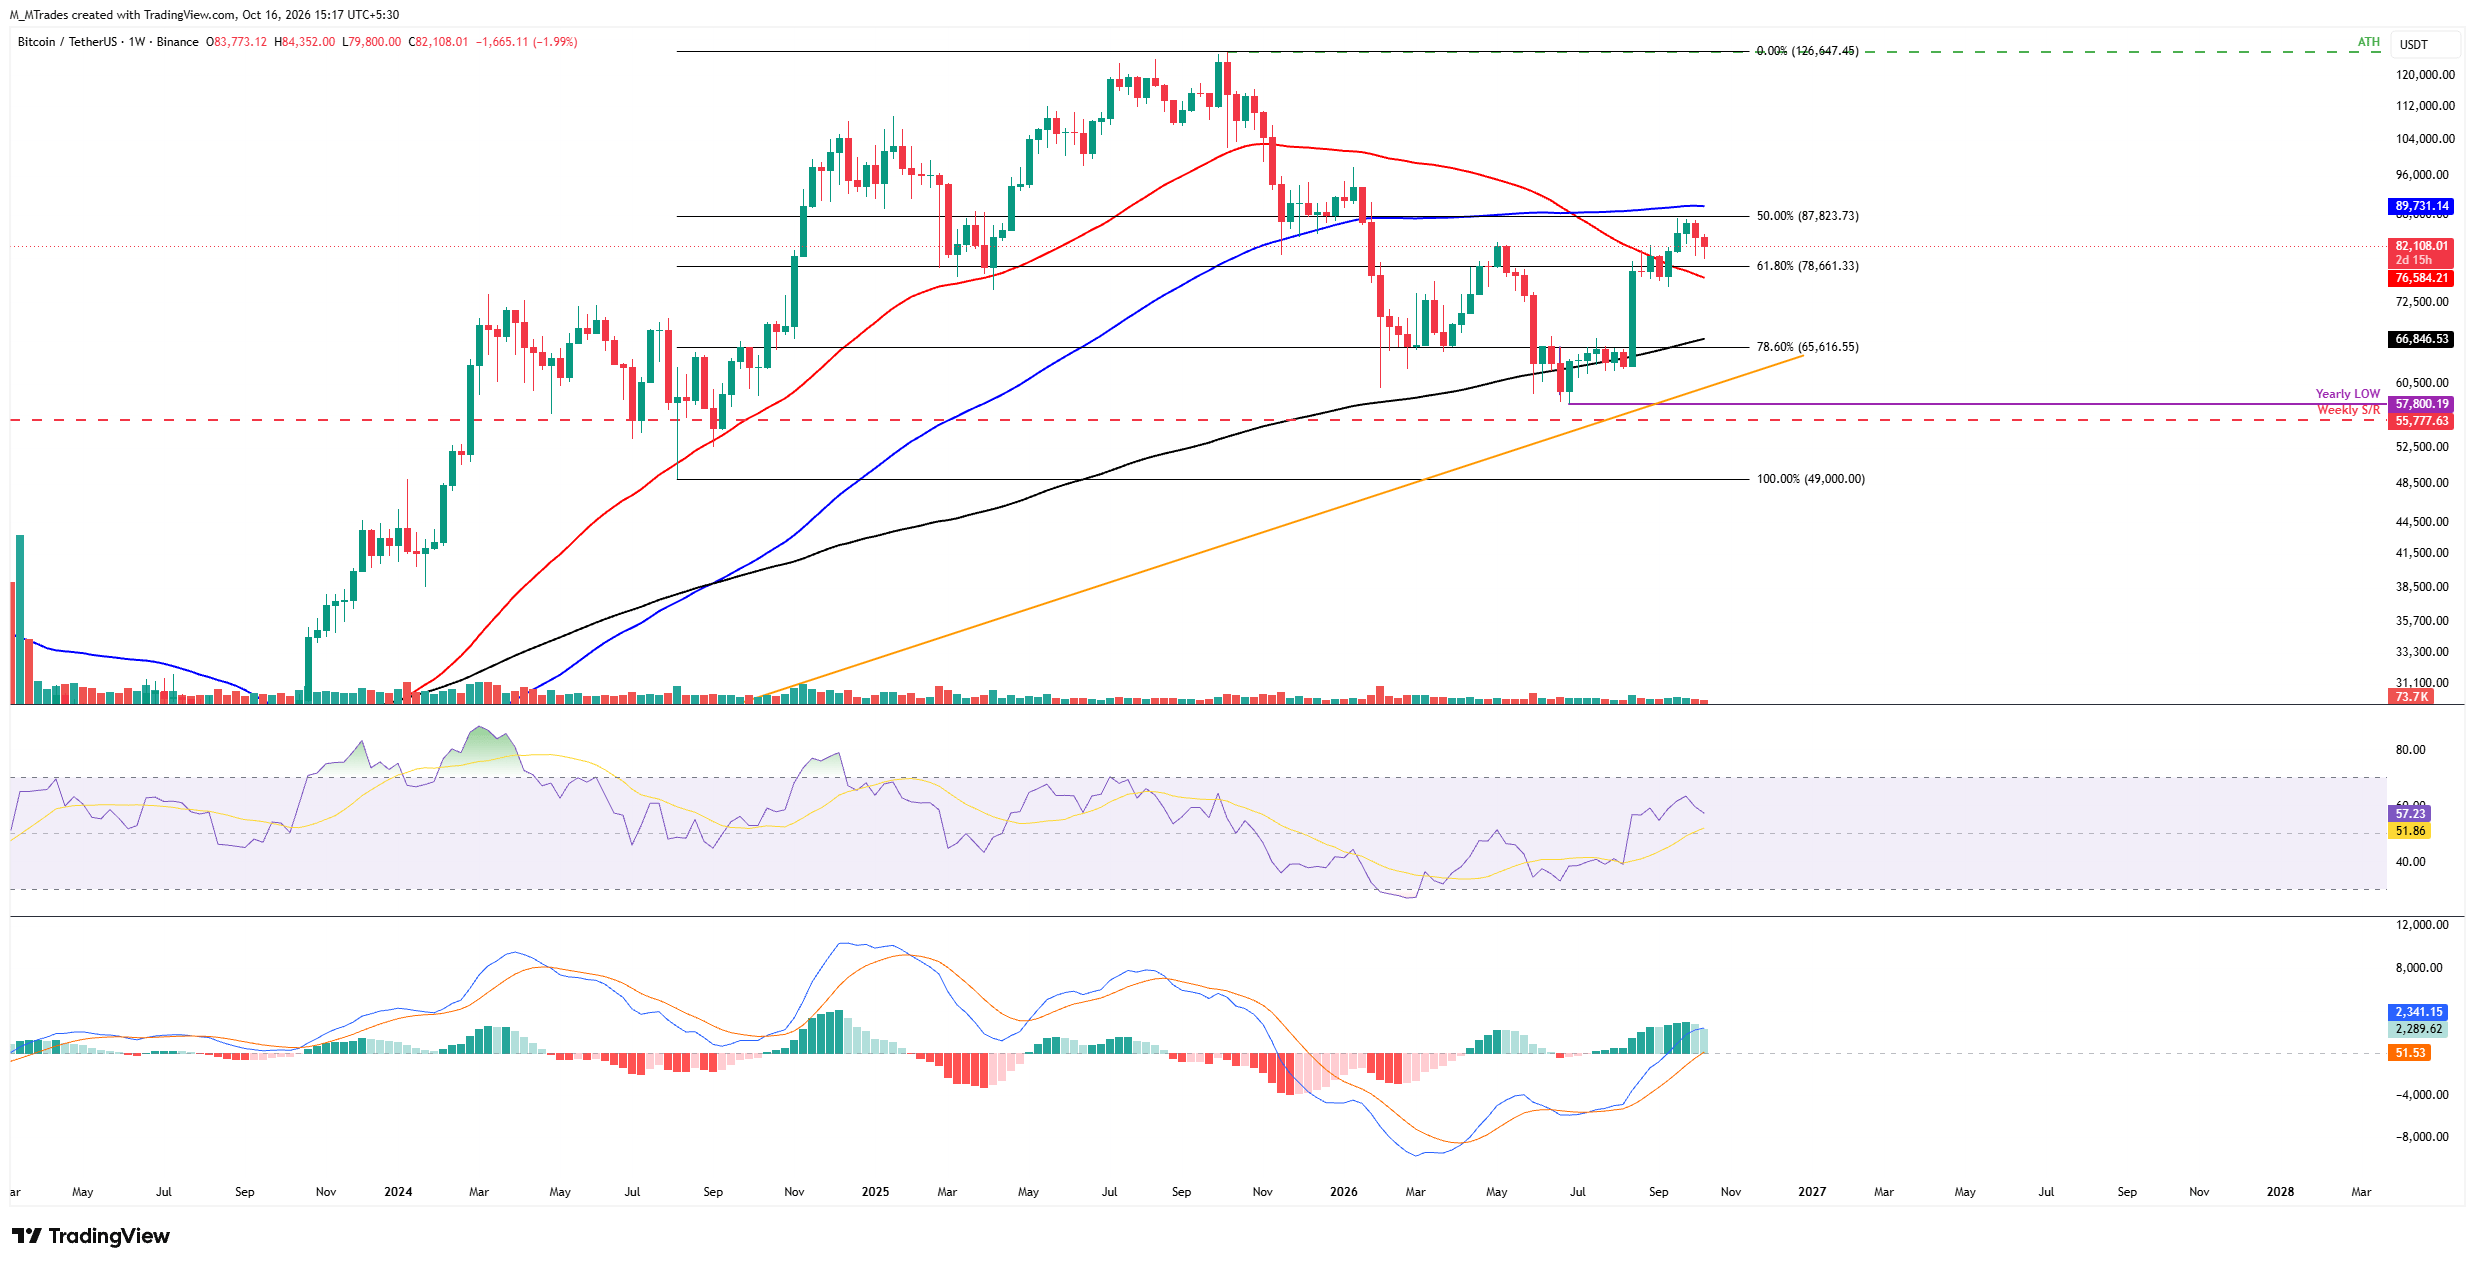
The Crypto King has extended losses by nearly 2% so far this week, trading below $82,200 as of Friday, after a 3.19% drop last week.
If BTC continues its correction, it could extend losses toward the 61.8% Fibonacci retracement level of $78,661 (drawn from the August 2024 low of $49,000 to the October 2025 record high of $126,199), which roughly coincides with the 50-week Simple Moving Average (SMA) at $76,584.
The Relative Strength Index (RSI) on the weekly chart stands near 57, pointing downward toward the neutral 50 level, indicating that bullish momentum is cooling. Meanwhile, the Moving Average Convergence Divergence (MACD) histogram remains positive, although its bars are weakening. This suggests that the broader upside momentum remains intact but is losing strength amid nearby resistance and the ongoing price pullback.
On the other hand, if BTC recovers, it could extend the advance toward the 50% retracement level of $87,823, then the 100-week SMA at $89,731.
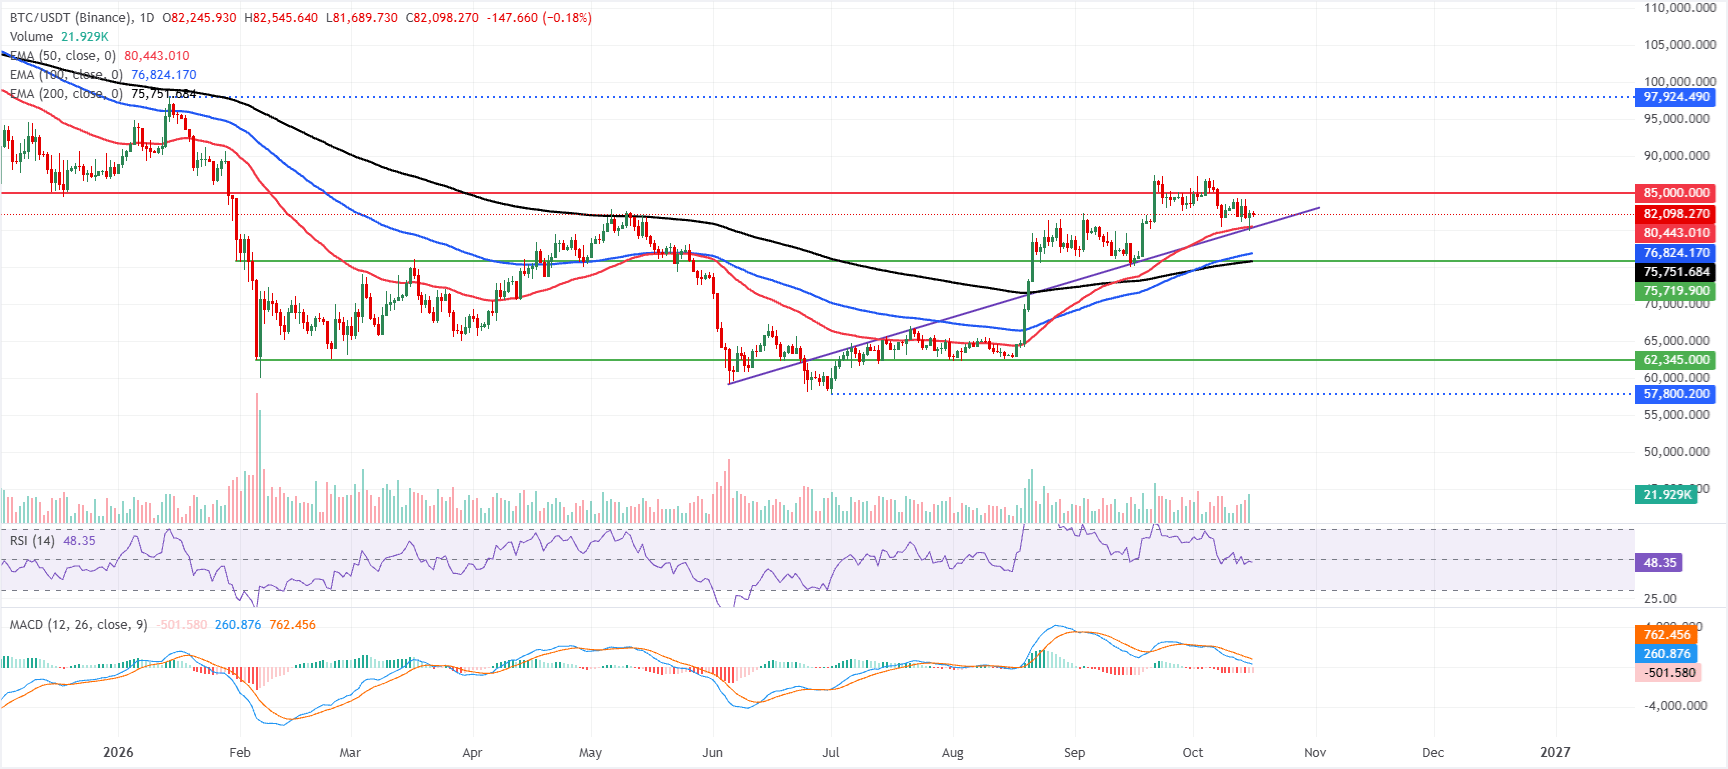
On the daily chart, the largest cryptocurrency by market capitalization holds above the 50-day, 100-day, and 200-day Exponential Moving Averages (EMAs), keeping the near-term bias constructive.
The 50-day EMA at $80,443 is the nearest dynamic floor. At the same time, the daily RSI around 48 suggests fading bullish momentum, and the MACD indicator remains below zero with a negative histogram, hinting that bullish pressure is moderate rather than impulsive.
On the topside, initial resistance aligns with the horizontal barrier at $85,000, where supply could cap further gains.
On the downside, immediate support is seen at the 50-day EMA at $80,443, followed by the 100-day EMA at $76,824 and the 200-day EMA at $75,751, levels that collectively reinforce the broader uptrend as long as price holds above them.
(The technical analysis of this story was written with the help of an AI tool. Know more.)
Bitcoin, altcoins, stablecoins FAQs
Bitcoin is the largest cryptocurrency by market capitalization, a virtual currency designed to serve as money. This form of payment cannot be controlled by any one person, group, or entity, which eliminates the need for third-party participation during financial transactions.
Altcoins are any cryptocurrency apart from Bitcoin, but some also regard Ethereum as a non-altcoin because it is from these two cryptocurrencies that forking happens. If this is true, then Litecoin is the first altcoin, forked from the Bitcoin protocol and, therefore, an “improved” version of it.
Stablecoins are cryptocurrencies designed to have a stable price, with their value backed by a reserve of the asset it represents. To achieve this, the value of any one stablecoin is pegged to a commodity or financial instrument, such as the US Dollar (USD), with its supply regulated by an algorithm or demand. The main goal of stablecoins is to provide an on/off-ramp for investors willing to trade and invest in cryptocurrencies. Stablecoins also allow investors to store value since cryptocurrencies, in general, are subject to volatility.
Bitcoin dominance is the ratio of Bitcoin's market capitalization to the total market capitalization of all cryptocurrencies combined. It provides a clear picture of Bitcoin’s interest among investors. A high BTC dominance typically happens before and during a bull run, in which investors resort to investing in relatively stable and high market capitalization cryptocurrency like Bitcoin. A drop in BTC dominance usually means that investors are moving their capital and/or profits to altcoins in a quest for higher returns, which usually triggers an explosion of altcoin rallies.
ARTIKEL POPULAR
1Brazilian Real: Election-driven support with downside risks – Commerzbank2Indian Rupee: RBI defence limits losses against US Dollar - DBS3GBP/JPY Price Forecast: Bulls test recovery momentum below key moving averages4Norwegian Krone: Stronger NOK profile into 2027 – Nordea5BoJ's Ueda signals further rate hikes as underlying inflation nears 2%6Singapore Dollar: Rebound prospects improve against US Dollar - OCBC7British Pound: UK resilience supports Sterling against Euro - Commerzbank8Japanese Yen struggles to gain ground despite softer US Dollar9US Dollar: AI focus clouds Fed path – MUFG
SEBUT HARGA LANGSUNG



Berhubung Dengan Kami









Hubungan
Telefon: +61 2 8036 8388
Faks: +61 2 8036 8388
E-mel: support@tmgm.com
Laman Web: https://www.tmg-max.com



Maklumat yang disediakan di laman web ini adalah bersifat umum sahaja dan tidak merupakan nasihat kewangan peribadi. Sebelum bertindak berdasarkan sebarang maklumat di laman web ini, anda harus mempertimbangkan kesesuaian maklumat tersebut berhubung dengan objektif, keadaan kewangan dan keperluan anda. Pelaburan dalam CFD dan Kontrak Margin FX melibatkan risiko yang ketara dan tidak sesuai untuk semua pelabur. Anda mungkin mengalami kerugian melebihi deposit awal anda. Anda tidak memiliki, atau mempunyai, sebarang kepentingan dalam aset pendasar. Kami mengesyorkan agar anda mendapatkan nasihat bebas dan memastikan anda memahami sepenuhnya risiko yang terlibat sebelum berdagang. Adalah penting untuk anda membaca dan mempertimbangkan dokumen pendedahan sebelum anda memperoleh sebarang produk yang disenaraikan di laman web ini. Maklumat dan iklan yang ditawarkan di laman web ini tidak bertujuan untuk digunakan oleh mana-mana individu di mana-mana negara atau bidang kuasa yang penggunaan sedemikian akan bercanggah dengan undang-undang dan peraturan tempatan. Produk dan Perkhidmatan yang ditawarkan di laman web ini tidak ditujukan kepada penduduk Amerika Syarikat, Malaysia dan Thailand.
TMGM diberi kuasa dan dikawal selia dalam pelbagai bidang kuasa.
Trademax Australia Limited, berdagang sebagai TMGM, dikawal selia oleh Suruhanjaya Sekuriti dan Pelaburan Australia (ASIC), AFSL no. 436416 dan terletak di Aras 28, One International Tower, 100 Barangaroo Avenue, 2000 Sydney, NSW Australia.
E-mel: support@tmgm.com.au
Trademax Global Limited, berdagang sebagai TMGM, diberi kuasa dan dikawal selia oleh Suruhanjaya Perkhidmatan Kewangan Vanuatu (VFSC), nombor pendaftaran 40356 dan didaftarkan di 1276, Kumul Highway, Port Vila, Vanuatu, Republik Vanuatu.
E-mel: support@tmgm.com
Trademax Global Markets (SE) Limited, yang beroperasi sebagai TMGM, dilesenkan dan dikawal selia oleh Pihak Berkuasa Perkhidmatan Kewangan (FSA) Seychelles, dengan nombor lesen SD224. Syarikat ini didaftarkan di Pejabat No. 13, Providence Estate ABIS Centre, Mahe, Seychelles.
E-mel: support@tmgm.com
Trademax Global Markets (International) Pty Ltd, berdagang sebagai TMGM, diberi kuasa dan dikawal selia oleh Suruhanjaya Perkhidmatan Kewangan, Mauritius (FSC) dengan lesen no. GB22201012, dan didaftarkan di 33, Edith Cavell Street C/o IQ EQ Fund Services (Mauritius) Ltd Port Louis, 11324 Mauritius.
E-mel: support@tmgm.com
Hak Cipta © TMGM. Semua hak terpelihara