

Negociação
Explore uma ampla variedade de mercados com preços competitivos, alta liquidez e ferramentas de negociação avançadas.
Saiba Mais 
Plataforma
Negocie sem interrupções com a poderosa plataforma da TMGM, desenvolvida para velocidade, precisão e uma experiência de negociação superior.
Saiba Mais Plataforma de Negociação
Ferramentas de Negociação
Academia
Aprenda os fundamentos da negociação com recursos para iniciantes, incluindo guias, webinars e insights de mercado.
Saiba Mais TMGM Academy
Notícias & Análise
Receba atualizações de mercado em tempo real e análises de especialistas para se antecipar às oportunidades de negociação.
Saiba Mais Notícias & Análise
Sobre
Descubra o que diferencia a TMGM — nossa presença global, força regulatória e compromisso com a inovação em negociação.
Saiba Mais Por Que Escolher a TMGM
NZD/USD Price Forecast: Bullish momentum improves but 0.5630 keeps holding bulls
- The New Zealand Dollar bounces up above 0.5600 but remains capped below the top of the weekly range.
- The strong demand in a US 30-year Treasury bond auction on Thursday has eased pressure on yields and allowed for a moderate risk appetite.
- The widening RBNZ-Fed monetary policy divergence is acting as a headwind for NZD recovery.
The New Zealand Dollar (NZD) picks up against the US Dollar (USD) on Friday, as some easing in the global bonds’ rout has allowed for a modest recovery of risk appetite during the Asian session. The NZD/USD pair has returned above 0.5600, but remains unable to break the top of the weekly trading range, in the 0.5630-0.5640 area, which keeps price action relatively close to the 18-month lows, at 0.5580.

Investors’ mood brightened somewhat during Friday’s Asian session after a US 30-year bond auction was received with solid demand on Thursday, which pushed long-term Treasury yields down from multi-decade highs. The US Dollar Index (DXY), which measures the Greenback against a basket of six majors, is pulling back from 18-month lows, and risk-sensitive currencies like the Kiwi have found buyers.
From a wider perspective, however, the Kiwi remains one of the weakest major currencies in September, weighed by the increasing monetary policy divergence between the Reserve Bank of New Zealand (RBNZ) and the Federal Reserve (Fed). The RBNZ’s OCR rate, at 2.75%, is one of the lowest among the world’s main central banks. The Fed has raised its fed funds rate to the 3.75%-4% range over September and is expected to hike it at least by 50 further basis points in the next two quarters.
Technical Analysis: Potential double bottom at 0.5580
NZD/USD trades at 0.5615, with the broader bearish trend intact, although a potential double bottom at the 0.5580 area and the improving momentum on intraday charts are providing some hope of a deeper bullish correction. The 4-hour Relative Strength Index (14) is hovering around a neutral 54, and the Moving Average Convergence Divergence (MACD) is showing a slightly positive reading, yet this merely hints at stabilizing conditions rather than a clear bullish reversal.
Bulls need to break above the top of the consolidation range, in the 0.5630-0.5640 area, to confirm the double bottom pattern, and bring the September 24 and 28 highs, at 0.5687, into focus, ahead of the September 22 high, at 0.5740.
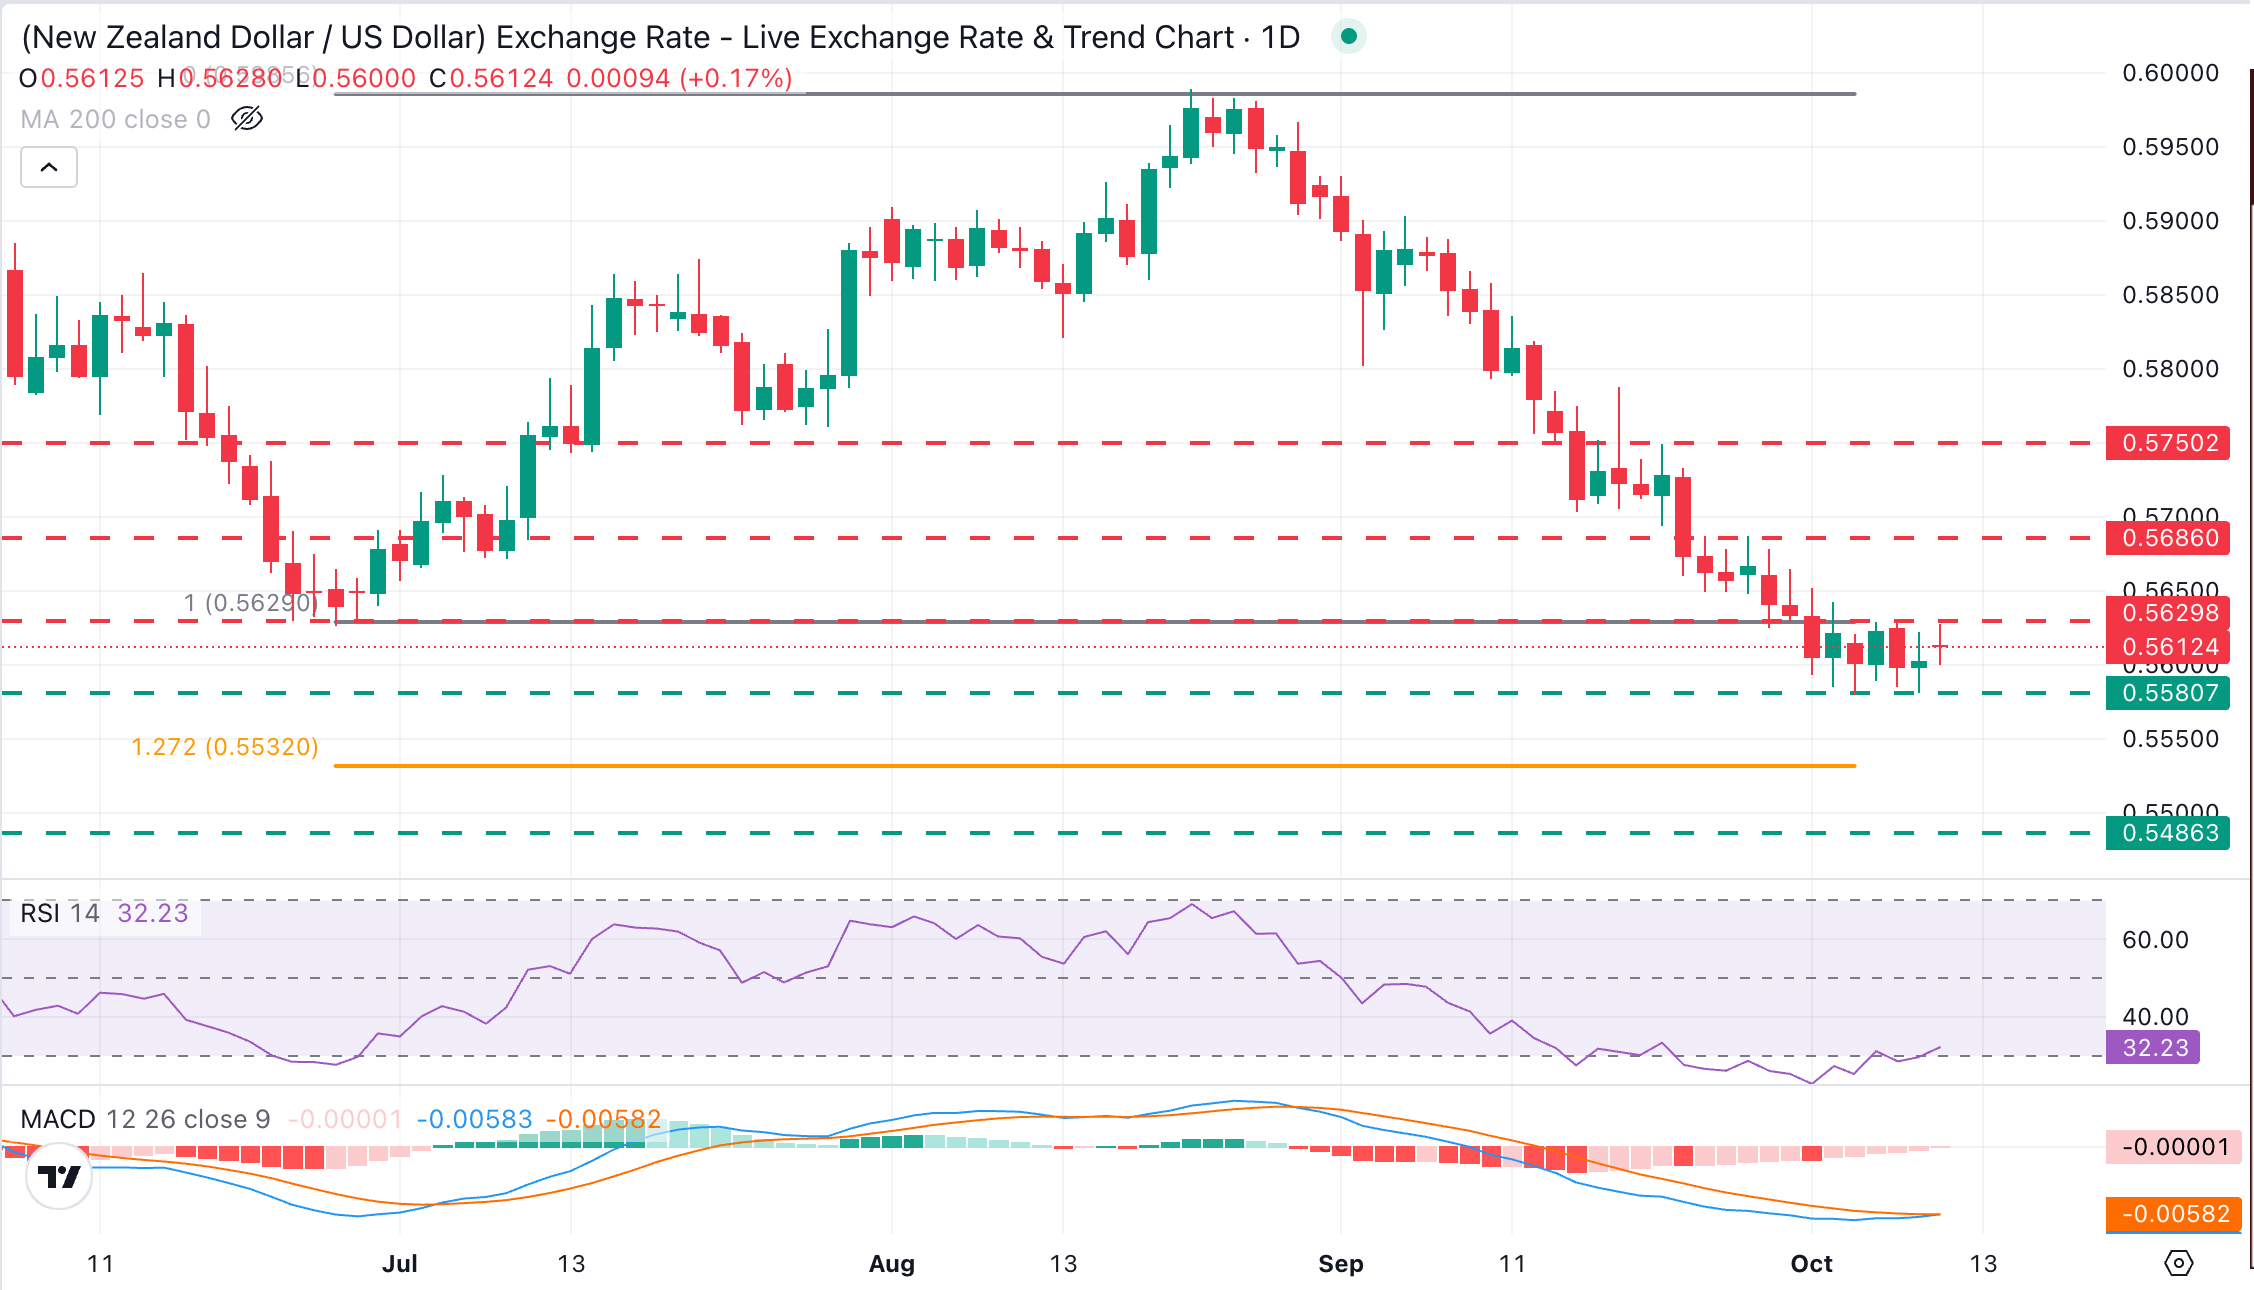
A bearish reaction below the 0.5580 support area (October 5 and 8 lows), on the contrary, would increase pressure towards the 127.2% Fibonacci retracement of the June-August rally, at 0.5530. Further down, the 2025 low, at 0.5485 is likely to be targeted.
(The technical analysis of this story was written with the help of an AI tool. Know more.)
New Zealand Dollar Price Today
The table below shows the percentage change of New Zealand Dollar (NZD) against listed major currencies today. New Zealand Dollar was the strongest against the Japanese Yen.
| USD | EUR | GBP | JPY | CAD | AUD | NZD | CHF | |
|---|---|---|---|---|---|---|---|---|
| USD | -0.12% | -0.08% | 0.30% | -0.00% | -0.30% | -0.16% | -0.21% | |
| EUR | 0.12% | 0.03% | 0.43% | 0.11% | -0.18% | -0.01% | -0.11% | |
| GBP | 0.08% | -0.03% | 0.40% | 0.10% | -0.21% | -0.04% | -0.09% | |
| JPY | -0.30% | -0.43% | -0.40% | -0.30% | -0.60% | -0.45% | -0.49% | |
| CAD | 0.00% | -0.11% | -0.10% | 0.30% | -0.32% | -0.16% | -0.19% | |
| AUD | 0.30% | 0.18% | 0.21% | 0.60% | 0.32% | 0.16% | 0.13% | |
| NZD | 0.16% | 0.01% | 0.04% | 0.45% | 0.16% | -0.16% | -0.03% | |
| CHF | 0.21% | 0.11% | 0.09% | 0.49% | 0.19% | -0.13% | 0.03% |
The heat map shows percentage changes of major currencies against each other. The base currency is picked from the left column, while the quote currency is picked from the top row. For example, if you pick the New Zealand Dollar from the left column and move along the horizontal line to the US Dollar, the percentage change displayed in the box will represent NZD (base)/USD (quote).
ARTIGOS POPULARES
1Silver price today: Silver rises, according to FXStreet data2Polish Zloty: Dovish NBP signals weigh on PLN – Commerzbank3Canadian Dollar: Jobs data and BoC path – ING4Ethereum activates Glamsterdam on Sepolia testnet: Why the price is falling anyway5Euro extends recovery due to relief from drop in French bond yields6British Pound: Mild downside bias against US Dollar - UOB7WTI Price Forecast: Slides back to mid-$89.00s as Mideast jitters limit losses8USD/CHF Price Forecast: Testing support at 0.8300 with bearish momentum building up9Euro: ECB minutes signal limited need for further tightening - Danske Bank
COTAÇÕES AO VIVO


Comece Agora!
Cadastre-se e acesse os Mercados Globais em menos de 3 minutos

Conecte-se Conosco









Contatos
Telefone: +61 2 8036 8388
Fax: +61 2 8036 8388
Email: support@tmgm.com



As informações fornecidas neste website são apenas de natureza geral e não constituem aconselhamento financeiro pessoal. Antes de agir com base em qualquer informação neste website, deve considerar a adequação da informação em relação aos seus objetivos, situação financeira e necessidades. Investir em CFDs e contratos de margem de FX envolve riscos significativos e não é adequado para todos os investidores. Poderá perder mais do que o seu depósito inicial. Não possui, nem detém, qualquer interesse no ativo subjacente. Recomendamos que procure aconselhamento independente e que se certifique de que compreende plenamente os riscos envolvidos antes de negociar. É importante que leia e considere o documento de divulgação antes de adquirir qualquer produto listado no website. As informações e os anúncios oferecidos neste website não se destinam a ser utilizados por qualquer pessoa em qualquer país ou jurisdição onde tal utilização seja contrária às leis e regulamentos locais. Os Produtos e Serviços oferecidos neste website não se destinam a residentes dos Estados Unidos, da Malásia e da Tailândia.
A TMGM é autorizada e regulada em várias jurisdições.
Trademax Australia Limited, operando como TMGM, é regulada pela Comissão Australiana de Valores Mobiliários e Investimentos (ASIC), AFSL nº 436416 e está localizada no Level 28, One International Tower, 100 Barangaroo Avenue, 2000 Sydney, NSW Austrália.
Email: support@tmgm.com.au
Trademax Global Limited, operando como TMGM, é autorizada e regulada pela Comissão de Serviços Financeiros de Vanuatu (VFSC), número de registro 40356 e registrada em 1276, Kumul Highway, Port Vila, Vanuatu, República de Vanuatu.
Email: support@tmgm.com
Trademax Global Markets (SE) Limited, operando como TMGM, é autorizada e regulada pela Autoridade de Serviços Financeiros (FSA) das Seychelles, sob o número de licença SD224. A empresa está registrada no Escritório nº 13, Providence Estate ABIS Centre, Mahe, Seychelles.
Email: support@tmgm.com
Trademax Global Markets (International) Pty Ltd, operando como TMGM, é autorizada e regulada pela Comissão de Serviços Financeiros de Maurício (FSC) com licença nº GB22201012, e registrada em 33, Edith Cavell Street C/o IQ EQ Fund Services (Mauritius) Ltd Port Louis, 11324 Maurício.
Email: support@tmgm.com
Copyright © TMGM. Todos os direitos reservados