

Trading
Tuklasin ang malawak na hanay ng mga merkado na may competitive na presyo, malalim na liquidity, at advanced na trading tools.
Matuto Pa 
Platform
Mag-trade nang walang sagabal gamit ang malakas na platform ng TMGM, na ginawa para sa bilis, katumpakan, at superior na trading experience.
Matuto Pa Trading Platform
Mga Trading Tools
Academy
Matuto ng mga pangunahing kaalaman sa trading gamit ang mga beginner-friendly na resources, kasama ang mga gabay, webinars, at market insights.
Matuto Pa TMGM Academy
Balita at Analysis
Makakuha ng real-time na mga update sa merkado at expert analysis upang manatiling nangunguna sa mga trading opportunities
Matuto Pa Balita at Analysis
Tungkol
Alamin kung ano ang nagpapangiiba sa TMGM — ang aming global presence, regulatory strength, at commitment sa innovation sa trading.
Matuto Pa Bakit Piliin ang TMGM
Sponsorship
Pepe Price Forecast: PEPE signals trend reversal amid a short squeeze
- Pepe is up 10% on Tuesday, advancing the 19% gains from the previous day and last week’s 18% rise.
- Derivatives data signals renewed demand amid a short squeeze of over $2 million over the last 24 hours.
- The technical outlook for PEPE is bullish as the price surpasses a long-term resistance trendline.
Pepe (PEPE) price is up nearly 30% in the last 24 hours, outperforming most top cryptocurrencies and hinting at further upside potential. Derivatives data suggest a short squeeze of more than $2 million during the same period, forcing traders to buy back positions in the meme coin. The technical outlook for PEPE indicates an upside bias as bullish momentum strengthens.

Short squeeze triggers Pepe rally
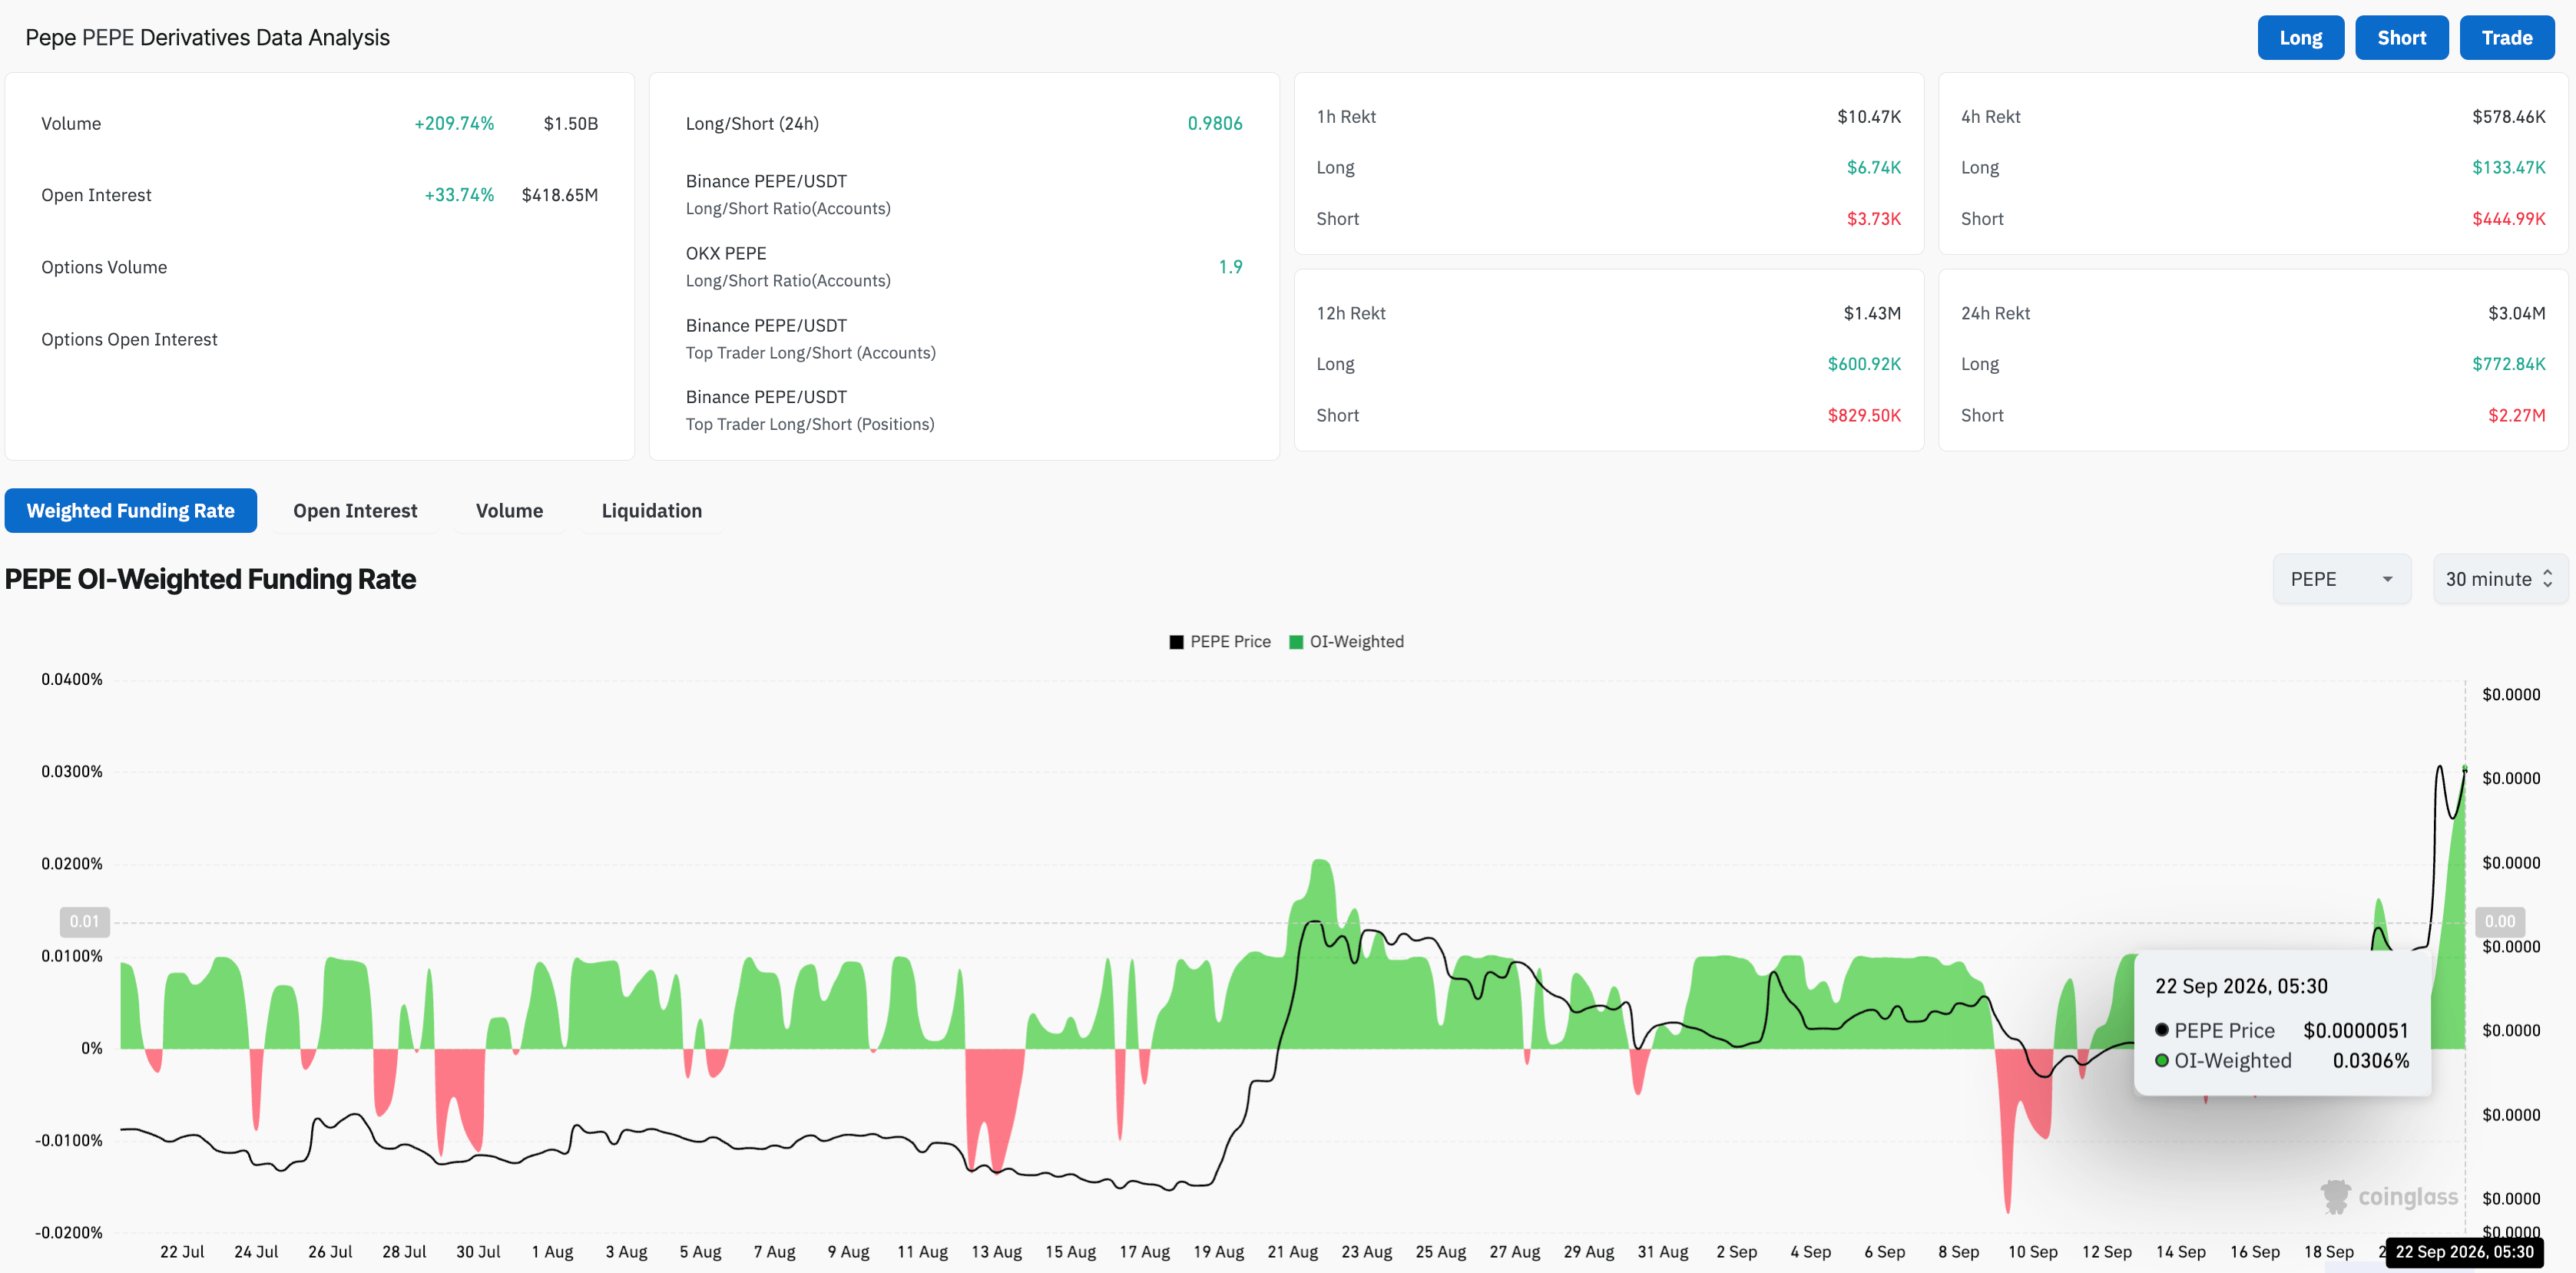
Pepe extends double-digit gains so far this week, advancing its 18% rise from last week. CoinGlass data shows that of the $3.04 million in total liquidation over 24 hours, $2.27 million came from short positions. This indicates that bearish bets on the meme coin failed, leading to a buyback.
The positive feedback drove PEPE futures Open Interest (OI) up more than 30% in the same period to $418.65 million, while trading volume surged by over 200% to $1.50 billion. This indicates strong retail participation, which typically fuels a bull run in meme coins.
A sharp spike in the PEPE funding rate of 0.0306% indicates a surge in traders’ demand to buy long positions, even at a premium, likely driven by the short-squeeze buyback.
Technical outlook: Is Pepe ready for a bullish trend reversal?
Pepe is up 10% on Tuesday, building on the 18% rise from the previous day. The meme coin is up 50% in less than 10 days, hinting at a bullish trend reversal as the broader crypto market recovers.
The rally has surpassed a long-term resistance trendline, connecting the July 22, 2025, and September 13, 2025, highs, near $0.00000414, reaffirming the trend reversal thesis. In addition, PEPE hovers above the 127.2% Fibonacci extension level, measured from $0.00000456 to $0.00000320, at $0.00000502. A confirmed breakout above this level could target the 161.8% extension level at $0.00000567.
The Relative Strength Index (RSI) at around 75 slips into overbought territory, hinting that the latest push higher in momentum may be running into exhaustion.
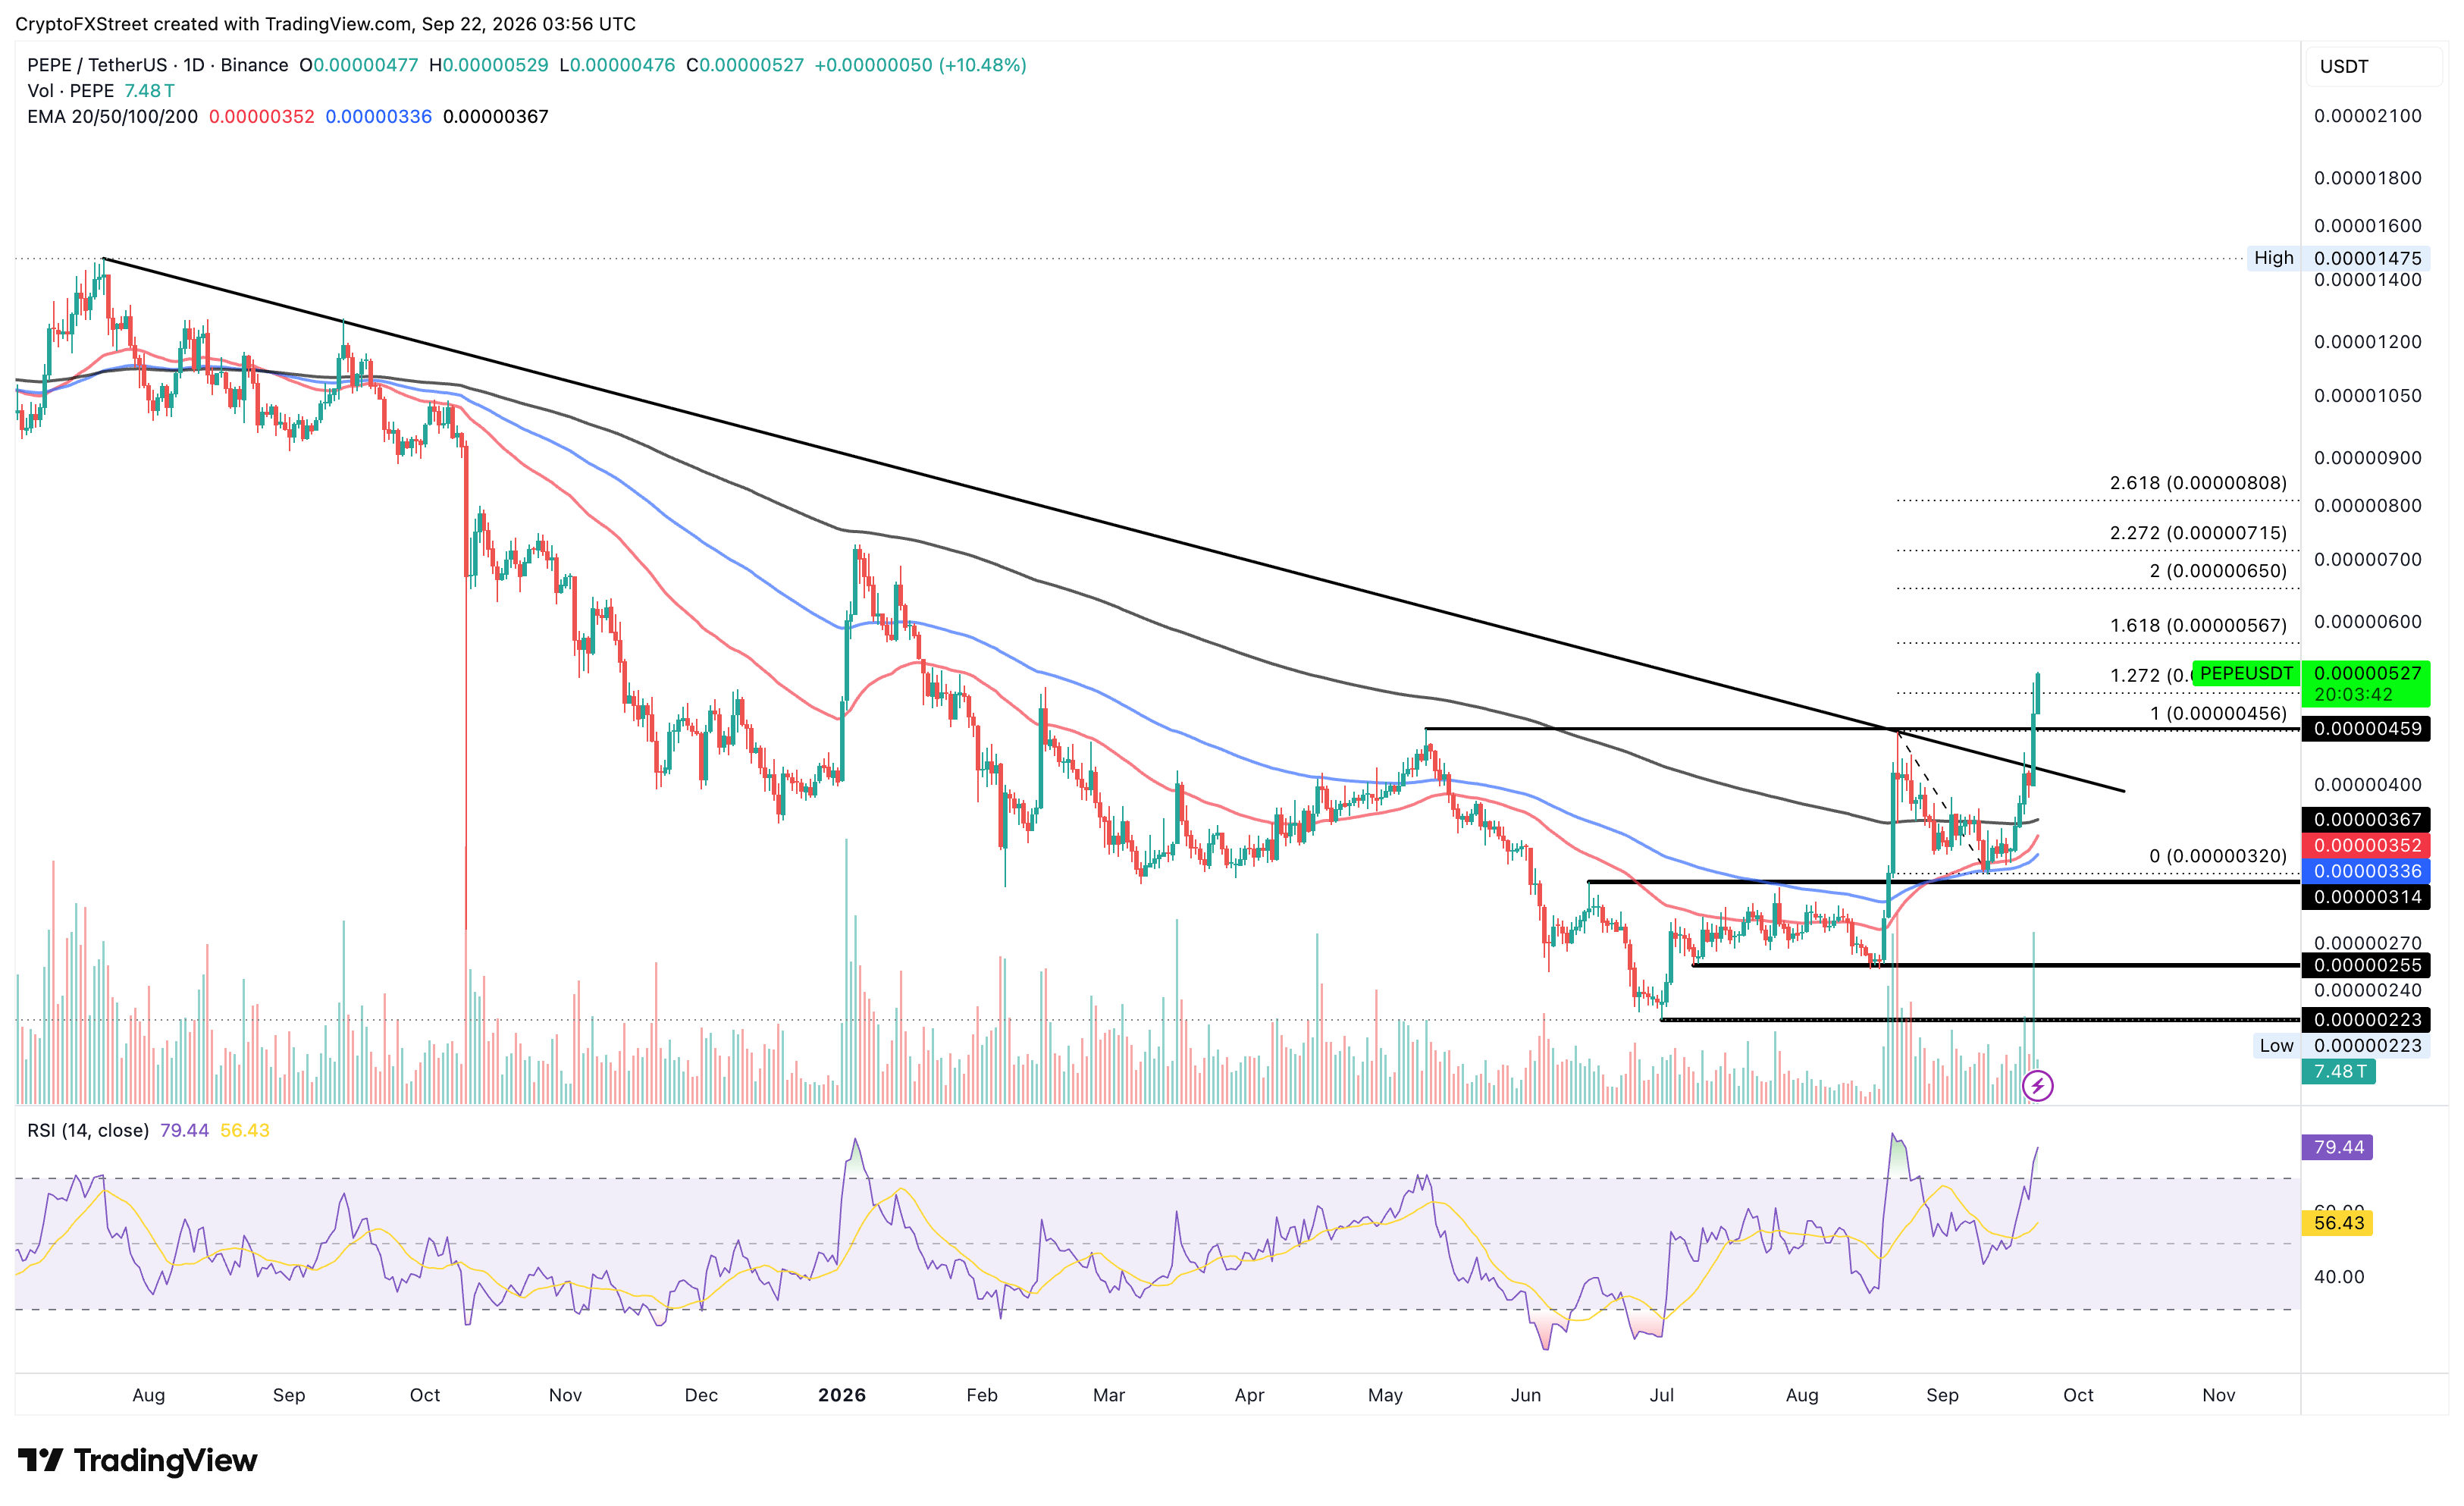
On the downside, the Fibonacci anchor at $0.00000456 and the broken trendline at $0.00000414 could serve as support levels in the event of a pullback.
(The technical analysis of this story was written with the help of an AI tool. Know more.)
Sikat na Artikulo
1Indian Rupee gains as oil prices remain broadly in corrective phase2Silver Price Forecast: XAG/USD holds losses near $66.00 amid Fed rate hike bets3WTI Price Forecast: Looks to reclaim $93.00 after defending 38.2% Fibo. support4Shiba Inu Price Forecast: SHIB extends gains as trading volume and Open Interest climb5EUR/USD Price Forecast: Holds gains above 1.1450, but remains technically bearish below 100-day SMA6Pepe Price Forecast: PEPE signals trend reversal amid a short squeeze7India Gold price today: Gold falls, according to FXStreet data8AUD/JPY Price Forecast: Sticks to gains above 112.00 as bulls await 50% Fibo. breakout9Swiss Franc gains as US Dollar declines on increased risk appetite
LIVE QUOTES

LAHAT TUNGKOL SA TECHNICAL
Ano ang Dark Cloud Cover Pattern at Paano Ito I-trade?
Ano ang Piercing Line Candlestick Pattern at Paano Ito Ipinagte-trade?
Ano ang mga candlestick pattern na Tweezer Top at Bottom?
Inside Bar na Pattern ng Candlestick: Ano Ito, Paano Ito Matutukoy, at Paano Ito I-trade
Hanging Man Candlestick Pattern: Paano Ito Matukoy at I-trade
Paano Gumuhit ng Fibonacci Retracement: Pagsasanay sa Golden Ratio sa Trading
Ano ang MACD at Paano Maghanap ng Entry at Exit Points
Ano ang RSI, ang Relative Strength Index
Ano ang Scalping sa Trading at Paano Ito Gumagana
Magsimula!
Mag-sign up at ma-access ang Global Markets sa loob ng 3 minuto

Makipag-ugnayan sa Amin









Mga Kontak
Telepono: +61 2 8036 8388
Fax: +61 2 8036 8388
Email: support@tmgm.com



Ang impormasyong ibinigay sa website na ito ay pangkalahatang impormasyon lamang at hindi bumubuo ng personal na payong pinansyal. Bago kumilos batay sa anumang impormasyon sa website na ito, dapat mong isaalang-alang ang pagiging angkop ng impormasyon kaugnay ng iyong mga layunin, kalagayang pinansyal, at mga pangangailangan. Ang pag-iinvest sa CFDs at FX Margin Contracts ay may kaakibat na malalaking panganib at hindi angkop para sa lahat ng mamumuhunan. Maaari kang mawalan ng higit pa sa iyong paunang deposito. Wala kang pagmamay-ari o anumang interes sa pinagbabatayang asset. Inirerekomenda namin na humingi ka ng independiyenteng payo at tiyaking lubos mong nauunawaan ang mga panganib na kasangkot bago makipagkalakalan. Mahalaga na basahin at isaalang-alang mo ang dokumento ng pagsisiwalat bago ka kumuha ng anumang produktong nakalista sa website. Ang impormasyon at mga patalastas na inaalok sa website na ito ay hindi nilalayong gamitin ng sinumang tao sa alinmang bansa o hurisdiksyon kung saan ang ganitong paggamit ay labag sa mga lokal na batas at regulasyon. Ang mga Produkto at Serbisyong inaalok sa website na ito ay hindi nilalayong para sa mga residente ng United States, Malaysia, at Thailand.
Ang TMGM ay awtorisado at pinangangasiwaan sa iba't ibang hurisdiksyon.
Ang Trademax Australia Limited, na nag-trading bilang TMGM, ay pinangangasiwaan ng Australian Securities and Investments Commission (ASIC), AFSL no. 436416 at matatagpuan sa Level 28, One International Tower, 100 Barangaroo Avenue, 2000 Sydney, NSW Australia.
Email: support@tmgm.com.au
Ang Trademax Global Limited, na nag-trading bilang TMGM, ay awtorisado at pinangangasiwaan ng Vanuatu Financial Services Commission (VFSC), registration number 40356 at nakarehistro sa 1276, Kumul Highway, Port Vila, Vanuatu, Republic of Vanuatu.
Email: support@tmgm.com
Ang Trademax Global Markets (SE) Limited, na kilala bilang TMGM, ay awtorisado at nire-regulahan ng Financial Services Authority (FSA) ng Seychelles, na may lisensya bilang SD224. Ang kumpanya ay nakarehistro sa Office Blg. 13, Providence Estate ABIS Centre, Mahe, Seychelles.
Email: support@tmgm.com
Ang Trademax Global Markets (International) Pty Ltd, na nag-trading bilang TMGM, ay awtorisado at pinangangasiwaan ng Financial Services Commission, Mauritius (FSC) na may license no. GB22201012, at nakarehistro sa 33, Edith Cavell Street C/o IQ EQ Fund Services (Mauritius) Ltd Port Louis, 11324 Mauritius.
Email: support@tmgm.com
Copyright © TMGM. Lahat ng karapatan ay nakalaan