

Savdo
Raqobatbardosh narxlar, chuqur likvidlik va ilg‘or savdo vositalari bilan keng turdagi bozorlarni kashf eting.
Batafsil ma’lumot 
Platforma
TMGM’ning tezlik, aniqlik va yuqori savdo tajribasi uchun yaratilgan kuchli platformasi bilan uzluksiz savdo qiling.
Batafsil ma’lumot Savdo platformasi
Savdo vositalari
Akademiya
Boshlovchilar uchun qulay resurslar, jumladan qo‘llanmalar, vebinarlar va bozor tahlillari orqali savdoning asoslarini o‘rganing.
Batafsil ma’lumot Yangiliklar va tahlil
Savdo imkoniyatlaridan oldinda bo‘lish uchun bozor yangilanishlari va ekspert tahlillarini real vaqt rejimida oling
Batafsil ma’lumot Yangiliklar va tahlil
Haqida
TMGMni boshqalardan ajratib turadigan jihatlarni bilib oling — bizning global mavjudligimiz, tartibga solishdagi mustahkamligimiz va savdoda innovatsiyalarga sodiqligimiz.
Batafsil ma’lumot Nega TMGMni tanlash kerak
Silver Price Forecast: XAG/USD faces roadblock near $53.50 as US Dollar regains ground
- Silver price surrenders some gains after surging to near $53.50.
- A slight recovery move in the US Dollar appears to act as roadblock for the Silver price.
- ING cautions over US Dollar’s medium-term outlook due to political headwinds.
Silver price (XAG/USD) gives back some of its early gains after rallying to near $53.50 on Thursday. In the European trade, the white metal is up 0.6% to near $52.50. The rally in the Silver price hits a roadblock as the US Dollar (USD) claws back some of its losses.
At press time, the US Dollar Index (DXY), which gauges the Greenback’s value against six major currencies, is marginally down to near 101.44. The DXY bounced back after revisiting its monthly low of 101.10 posted the previous day.
However, the outlook of the Silver price appears to be bullish as the victory of United States (US) Democrats in midterm elections has jeopardized the medium-term appeal of the US Dollar.
Technically, a lower US Dollar makes the Silver price an attractive risk-reward bet for investors.
Dollar outlook darkens on US political frictions into 2027
Analysts at ING suggest that the US political backdrop could become an additional headwind for the Dollar over the medium term. They argue that “the dollar could see a little more weakness into 2027, however, if an emboldened Democratic Party takes greater issue with Republican policy, including deregulation and the AI build-out.” ING adds that “the potential for a prolonged government shutdown in mid-2027 adds to the case for a weaker dollar next summer,” reinforcing their view that rising political frictions may increasingly weigh on the currency’s appeal.
Going forward, investors will pay attention to the US Nonfarm Payrolls (NFP) data for October, which will be released on Friday. The labor market data is expected to influence Federal Reserve’s (Fed) interest rate expectations.
Silver Technical Analysis
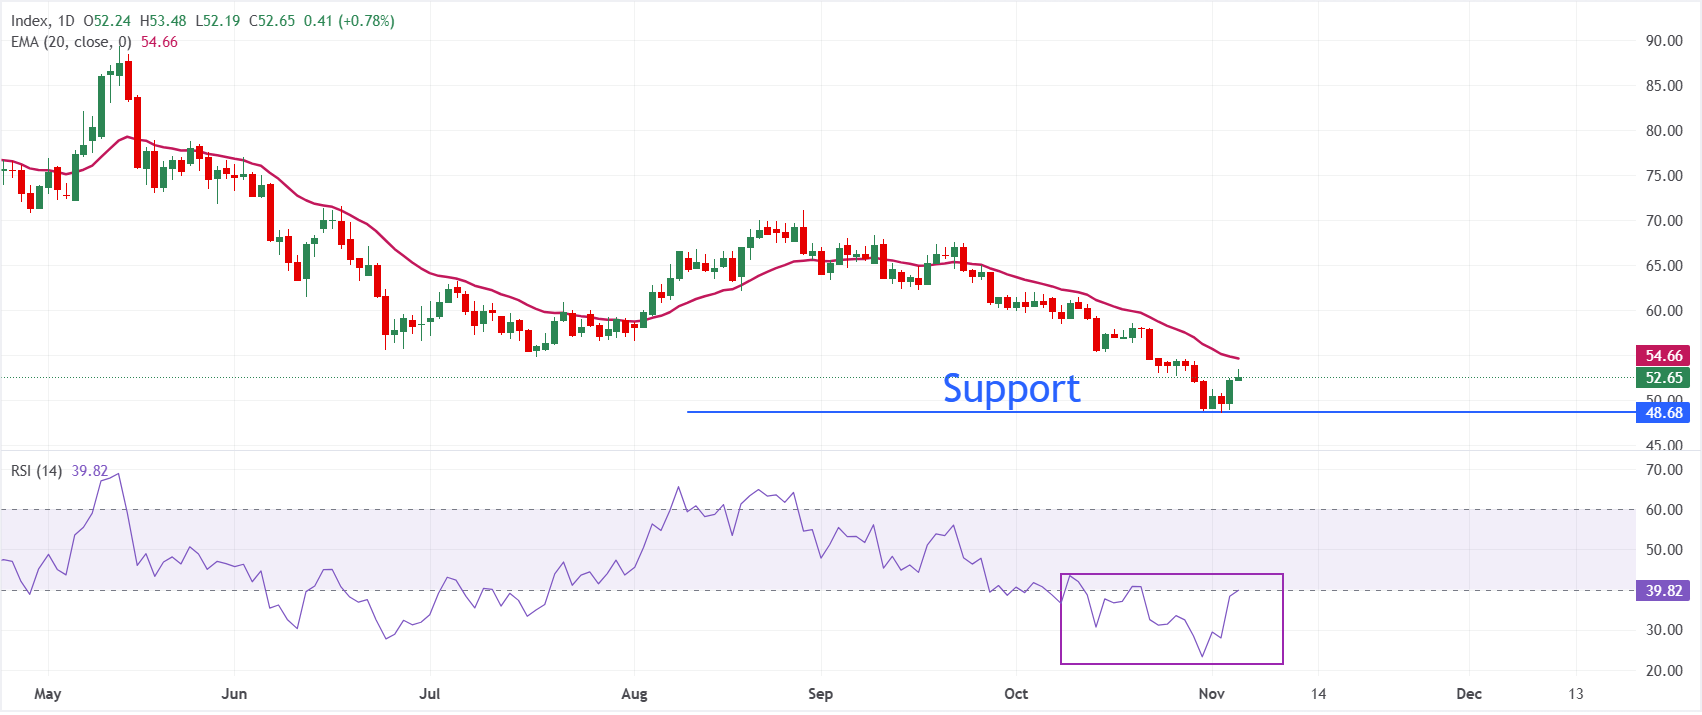
In the daily chart, XAG/USD trades at $52.66, maintaining a bearish near-term bias as spot holds below the 20-day exponential moving average (EMA) at $54.66. The slide away from the recent highs keeps price positioned under this dynamic barrier, while the Relative Strength Index (RSI) at 39.85 remains in bearish territory but off oversold extremes, hinting at weak but stabilizing downside momentum rather than an imminent reversal.
On the topside, the 20-day EMA at $54.66 is the first meaningful resistance that bulls would need to reclaim to ease immediate selling pressure and open the door to a more sustained recovery phase. On the downside, the November 3 low at $48.62 is the immediate support level.
(The technical analysis of this story was written with the help of an AI tool. Know more.)
Silver FAQs
Silver is a precious metal highly traded among investors. It has been historically used as a store of value and a medium of exchange. Although less popular than Gold, traders may turn to Silver to diversify their investment portfolio, for its intrinsic value or as a potential hedge during high-inflation periods. Investors can buy physical Silver, in coins or in bars, or trade it through vehicles such as Exchange Traded Funds, which track its price on international markets.
Silver prices can move due to a wide range of factors. Geopolitical instability or fears of a deep recession can make Silver price escalate due to its safe-haven status, although to a lesser extent than Gold's. As a yieldless asset, Silver tends to rise with lower interest rates. Its moves also depend on how the US Dollar (USD) behaves as the asset is priced in dollars (XAG/USD). A strong Dollar tends to keep the price of Silver at bay, whereas a weaker Dollar is likely to propel prices up. Other factors such as investment demand, mining supply – Silver is much more abundant than Gold – and recycling rates can also affect prices.
Silver is widely used in industry, particularly in sectors such as electronics or solar energy, as it has one of the highest electric conductivity of all metals – more than Copper and Gold. A surge in demand can increase prices, while a decline tends to lower them. Dynamics in the US, Chinese and Indian economies can also contribute to price swings: for the US and particularly China, their big industrial sectors use Silver in various processes; in India, consumers’ demand for the precious metal for jewellery also plays a key role in setting prices.
Silver prices tend to follow Gold's moves. When Gold prices rise, Silver typically follows suit, as their status as safe-haven assets is similar. The Gold/Silver ratio, which shows the number of ounces of Silver needed to equal the value of one ounce of Gold, may help to determine the relative valuation between both metals. Some investors may consider a high ratio as an indicator that Silver is undervalued, or Gold is overvalued. On the contrary, a low ratio might suggest that Gold is undervalued relative to Silver.
Eng yaxshi maqolalar
1Silver Price Forecast: XAG/USD faces roadblock near $53.50 as US Dollar regains ground2Norwegian Krone: Watching Norges Bank and energy prices – Commerzbank3RBA’s Hauser: Inflation is too high, whichever measure you use4Forex Today: Post-election USD weakness persists, focus shifts to BoE rate call5NZD/USD Price Analysis: Struggles to make it through 100-SMA hurdle near 0.5650 on H4 6Euro trims gains as German Factory Orders miss expectations7Brent: Election-driven risk premium unwinds – ING8US Dollar: Lower yields pressure USD after Democratic sweep – Danske Bank9Polygon Labs considers a hard fork to recover assets from Polymarket and Binance hacks


Boshlang!
Ro‘yxatdan o‘ting va 3 daqiqadan kamroq vaqt ichida Global bozorlariga kirish imkoniga ega bo‘ling

Biz bilan bog‘laning









Kontaktlar
Telefon: +61 2 8036 8388
Faks: +61 2 8036 8388
Email: support@tmgm.com



Ushbu veb-saytda taqdim etilgan ma’lumotlar faqat umumiy xususiyatga ega bo‘lib, shaxsiy moliyaviy maslahat hisoblanmaydi. Ushbu veb-saytdagi har qanday ma’lumot asosida harakat qilishdan oldin, ma’lumotning sizning maqsadlaringiz, moliyaviy ahvolingiz va ehtiyojlaringizga mosligini ko‘rib chiqishingiz kerak. CFD va FX Margin shartnomalariga sarmoya kiritish sezilarli xavflarni o‘z ichiga oladi va barcha investorlar uchun mos emas. Siz boshlang‘ich depozitingizdan ko‘proq yo‘qotishingiz mumkin. Siz asosiy aktivga egalik qilmaysiz va unda hech qanday manfaatga ega emassiz. Savdo qilishdan oldin mustaqil maslahat olishni va ishtirok etuvchi xavflarni to‘liq tushunishingizni tavsiya qilamiz. Veb-saytda keltirilgan har qanday mahsulotni xarid qilishdan oldin oshkor qilish hujjatini o‘qib chiqishingiz va ko‘rib chiqishingiz muhimdir. Ushbu veb-saytda taklif etilgan ma’lumotlar va reklama materiallari bunday foydalanish mahalliy qonunlar va qoidalarga zid bo‘ladigan har qanday mamlakat yoki yurisdiksiyadagi shaxslar tomonidan foydalanish uchun mo‘ljallanmagan. Ushbu veb-saytda taklif etilgan Mahsulotlar va Xizmatlar AQSh, Malayziya va Tailand rezidentlari uchun mo‘ljallanmagan.
TMGM turli yurisdiksiyalarda vakolatli va tartibga solinadi.
Trademax Australia Limited, TMGM nomi ostida faoliyat yuritadi, Avstraliya Qimmatli qog‘ozlar va investitsiyalar komissiyasi (ASIC) tomonidan tartibga solinadi, AFSL raqami 436416 va manzili: Level 28, One International Tower, 100 Barangaroo Avenue, 2000 Sydney, NSW Australia.
Email: support@tmgm.com.au
Trademax Global Limited, TMGM nomi ostida faoliyat yuritadi, Vanuatu Moliyaviy Xizmatlar Komissiyasi (VFSC) tomonidan vakolatli va tartibga solinadi, ro‘yxatga olish raqami 40356 va ro‘yxatdan o‘tgan manzili: 1276, Kumul Highway, Port Vila, Vanuatu, Vanuatu Respublikasi.
Email: support@tmgm.com
Trademax Global Markets (SE) Limited, TMGM nomi ostida faoliyat yuritadi, Seyshel orollari Moliyaviy Xizmatlar Boshqarmasi (FSA) tomonidan 224-sonli SD litsenziyasi bilan vakolatli va tartibga solinadi. Kompaniya Office No 13, Providence Estate ABIS Centre, Mahe, Seychelles manzilida ro‘yxatdan o‘tgan.
Email: support@tmgm.com
Trademax Global Markets (International) Pty Ltd, TMGM nomi ostida faoliyat yuritadi, Mauritius Moliyaviy Xizmatlar Komissiyasi (FSC) tomonidan GB22201012 litsenziya raqami bilan vakolatli va tartibga solinadi hamda 33, Edith Cavell Street C/o IQ EQ Fund Services (Mauritius) Ltd Port Louis, 11324 Mauritius manzilida ro‘yxatdan o‘tgan.
Email: support@tmgm.com
Mualliflik huquqi © TMGM. Barcha huquqlar himoyalangan