

Savdo
Raqobatbardosh narxlar, chuqur likvidlik va ilg‘or savdo vositalari bilan keng turdagi bozorlarni kashf eting.
Batafsil ma’lumot 
Platforma
TMGM’ning tezlik, aniqlik va yuqori savdo tajribasi uchun yaratilgan kuchli platformasi bilan uzluksiz savdo qiling.
Batafsil ma’lumot Savdo platformasi
Savdo vositalari
Akademiya
Boshlovchilar uchun qulay resurslar, jumladan qo‘llanmalar, vebinarlar va bozor tahlillari orqali savdoning asoslarini o‘rganing.
Batafsil ma’lumot Yangiliklar va tahlil
Savdo imkoniyatlaridan oldinda bo‘lish uchun bozor yangilanishlari va ekspert tahlillarini real vaqt rejimida oling
Batafsil ma’lumot Yangiliklar va tahlil
Haqida
TMGMni boshqalardan ajratib turadigan jihatlarni bilib oling — bizning global mavjudligimiz, tartibga solishdagi mustahkamligimiz va savdoda innovatsiyalarga sodiqligimiz.
Batafsil ma’lumot Nega TMGMni tanlash kerak
Zcash Price Forecast: ZEC rebounds as ZODL founder now supports ending community grants
- Zcash ticks higher above $1,250 on Monday, bouncing off a rising support trendline after two consecutive days of losses.
- ZODL founder Josh Swihart endorses ending the block reward share to Zcash Community Grants.
- ZEC ETF recorded an outflow of over $4 million on Friday, reducing the weekly total inflows to roughly $18 million.
Zcash (ZEC) shows signs of recovery on Monday, extending gains above $1,250 as the Zcash Open Development Lab (ZODL) founder, Josh Swihart, now supports the compromise proposal to end the 8% block reward share directed to Zcash Community Grants (ZCG). Institutional and retail investors show signs of renewed risk appetite for Zcash with the second weekly Exchange Traded Fund (ETF) inflows of roughly $18 million while its futures Open Interest rises to almost 2 million ZEC.
The technical outlook for Zcash indicates a near-term upside bias toward the $1,385 horizontal barrier, which has remained intact since October 6.
Zcash NU7 and compromise proposal in focus
Zcash's ecosystem developments could remain in focus this week, with the Network Upgrade 7 scheduled for November 5. The upgrade will reduce the block intervals to 25 seconds from 75 seconds, improving transaction confirmation times, and disable the Sprout pool and its transactions.
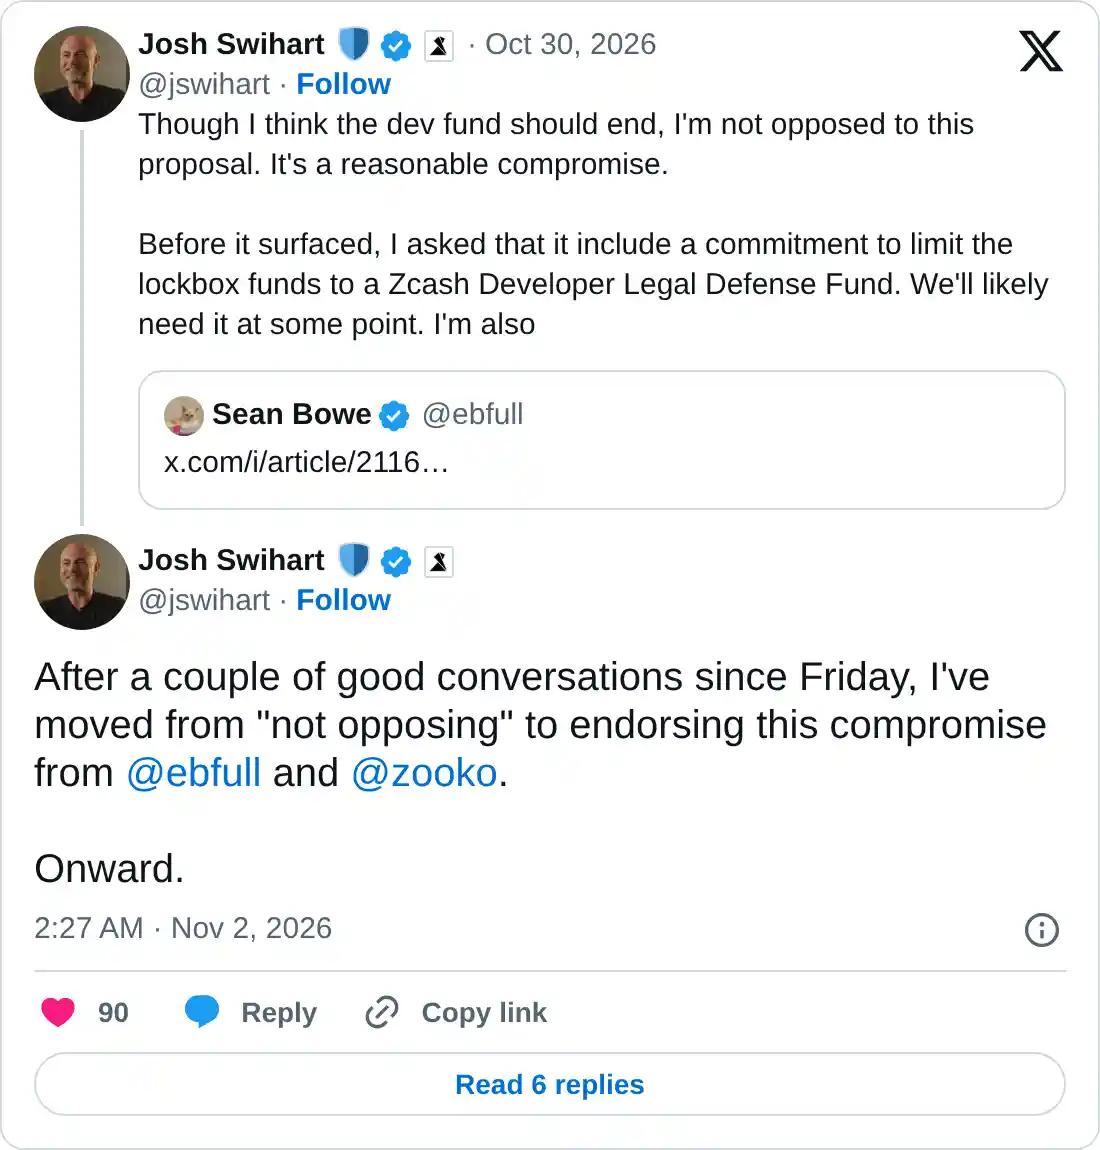
Meanwhile, ZODL’s founder Josh Swihart announced in an X post on Monday that he now supports the compromise proposal by Zcash co-founders Sean Bowe and Zooko Wilcox-O’Hearn to end the Zcash Community Grants' 8% block reward share. The proposal redirects these funds into a "Future Dev and Legal Defense Fund" lockbox. This will push ZCG to donate 50,000 ZEC to the Network Sustainability Mechanism, while the ongoing grants will continue from the existing treasury.
Demand resurfaces for Zcash
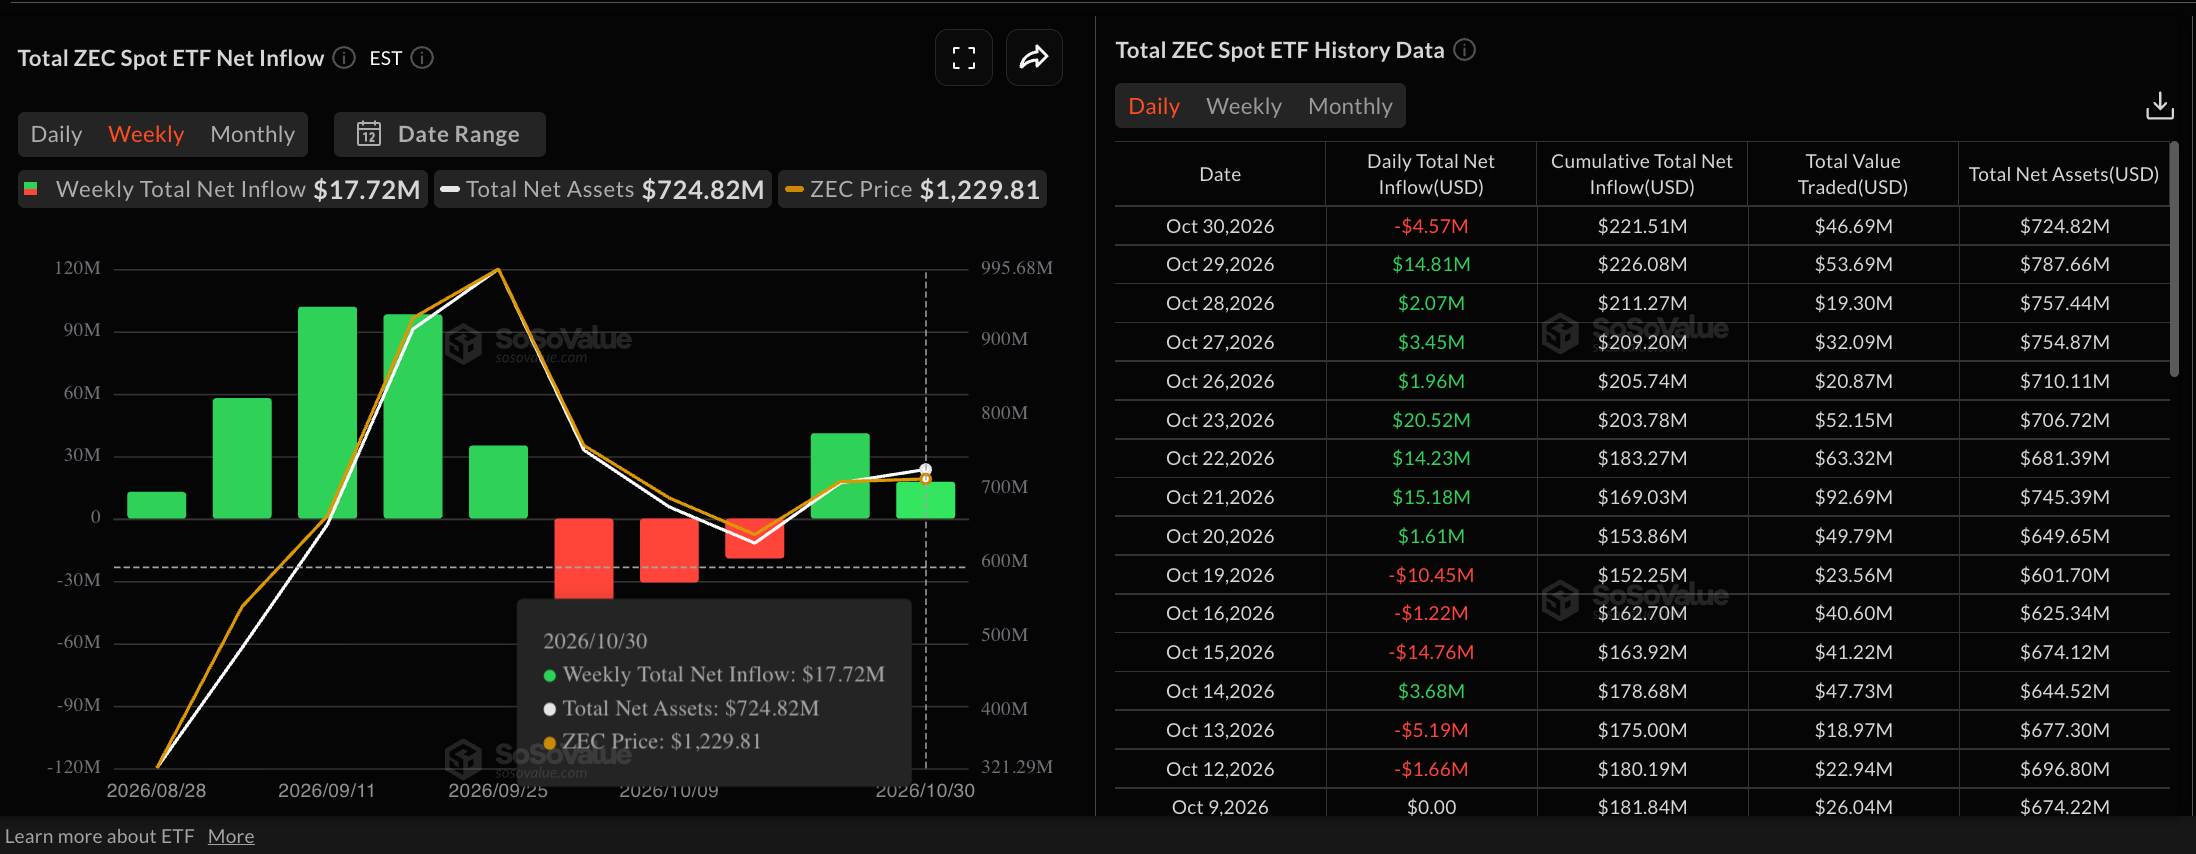
Zcash ETF has seen renewed buying pressure over the last two weeks, with $17.72 million in inflows last week, followed by $41.09 million. This streak follows three straight weeks of outflows after the 3-for-1 stock split on September 28, implying that the increased volume-driven selling pressure has faded. In addition, the renewed inflows align with the upcoming NU7 upgrade on November 5 and a potential change in network grants.
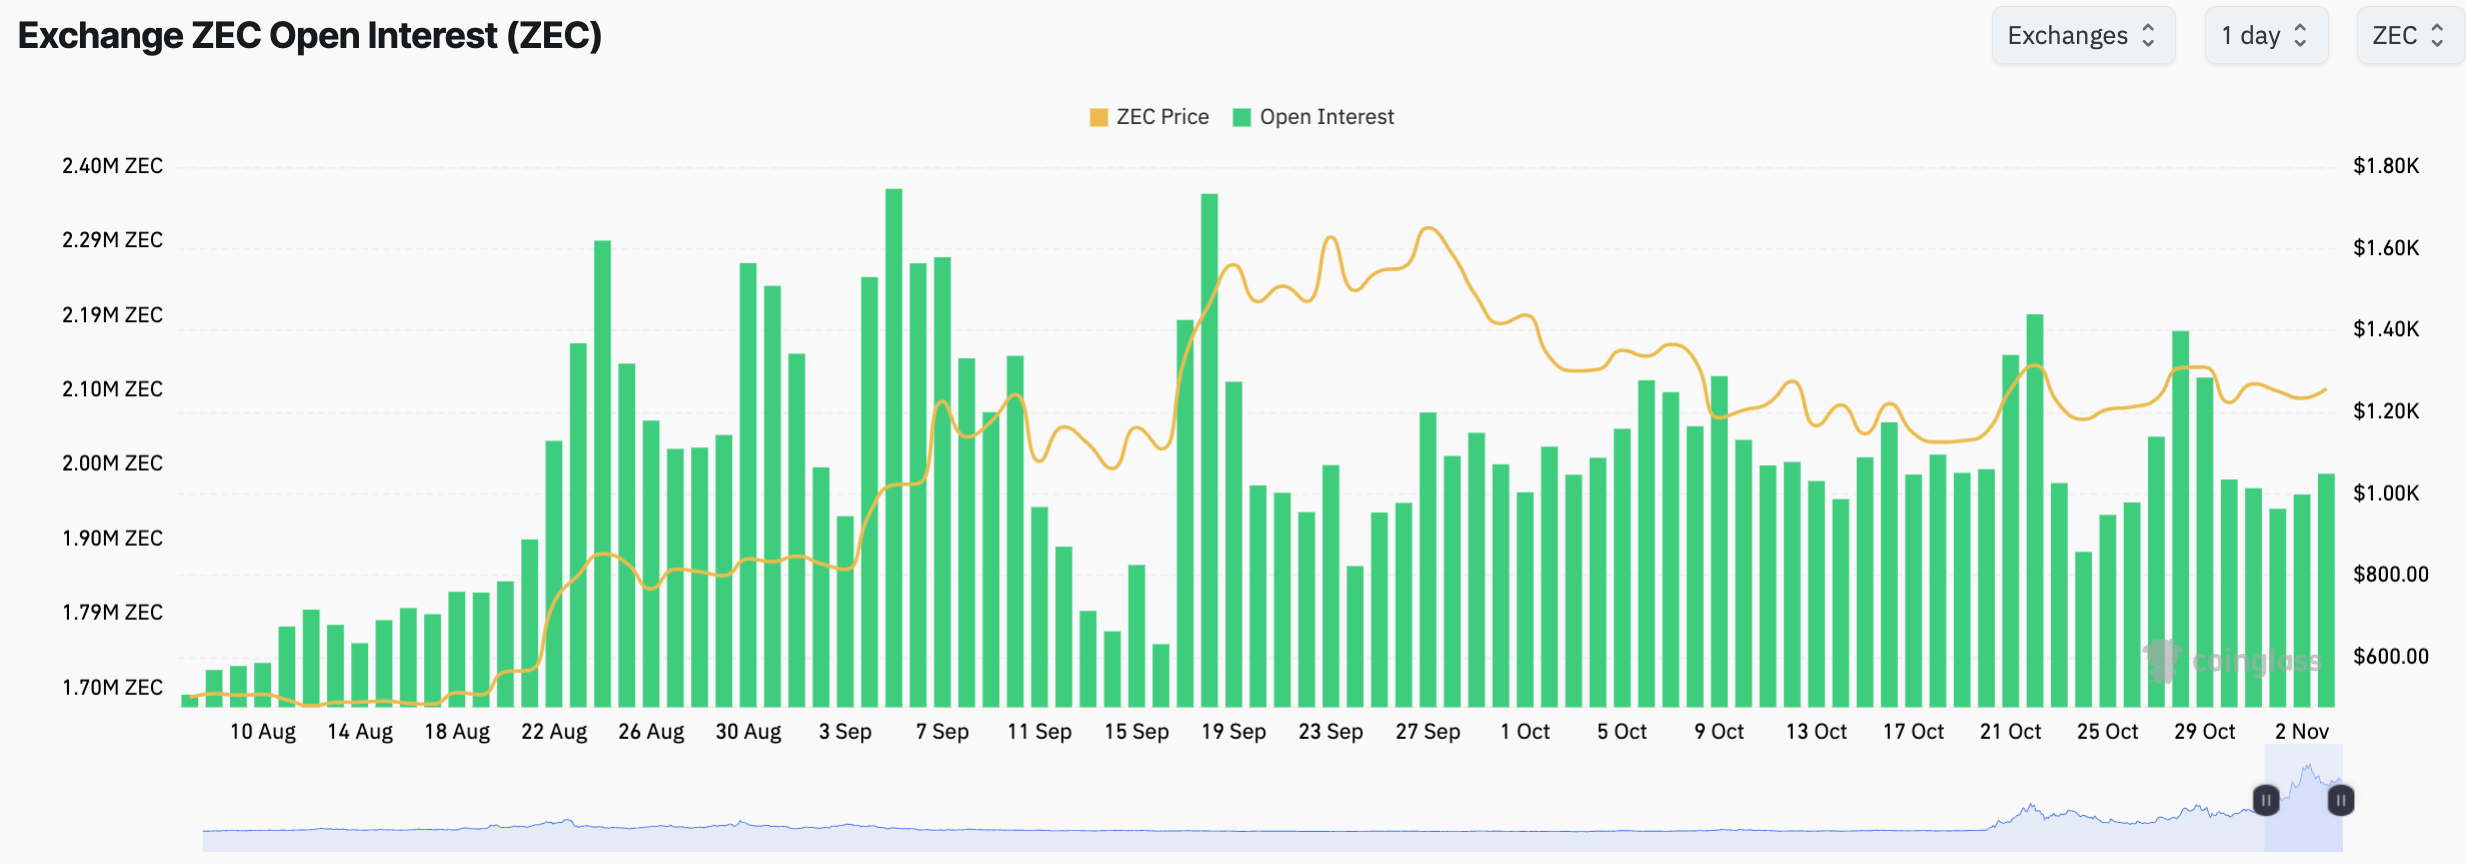
On the retail side, CoinGlass data shows the Zcash Open Interest (OI) at 1.99 million ZEC on Monday, up from 1.96 million ZEC on Sunday. This recovery in OI after declining to 1.94 million ZEC on Saturday from 2.18 million ZEC on Tuesday suggests a gradual positional buildup, reaffirming renewed risk appetite.
Technical outlook: Can Zcash price surpass the $1,385 barrier?
Zcash trades at $1,257, showing mild recovery on Monday. The privacy coin maintains a near-term bullish bias, with a rising trendline supporting the uptrend on the four-hour chart, connecting the October 18 and 30 lows near $1,215.
Zcash also reclaimed both the 50-period Exponential Moving Average (EMA) at $1,250 and the 200-period EMA at $1,240 on the same chart, suggesting buyers are defending key pivot zones.
Momentum shifts from bearish to neutral on the four-hour chart, with the Relative Strength Index (RSI) at 50, rising toward the neutral midline, and the Moving Average Convergence Divergence (MACD) holding flat below the signal and zero lines as histograms wane, suggesting that dips are being supported rather than aggressively sold.
On the topside, initial resistance lies at the October 6 high at $1,385, where a sustained break would pave the way for an extended rally. Based on the Fibonacci retracement from $1,385 to the October 18 low at $1,049, the 127.2% and 161.8% extension levels around $1,493 and $1,644 could emerge as the next key resistance levels.
On the downside, immediate support is seen around the 50- and 200-period EMAs at $1,250 and $1,240, forming a broader demand band below. Deeper pullbacks would likely find structural support near the 50% retracement at $1,205 and the rising trendline around $1,215, where buyers could attempt to reassert the prevailing uptrend.
(The technical analysis of this story was written with the help of an AI tool. Know more.)
Eng yaxshi maqolalar
1India Gold price today: Gold rises, according to FXStreet data2AUD/JPY Price Forecast: Holds gains near 111.00, but maintains bearish tone below 100-day SMA3Top 3 Price Predictions: Bitcoin, Ethereum, Ripple – BTC, ETH and XRP rebound as November begins after a losing October4Zcash Price Forecast: ZEC rebounds as ZODL founder now supports ending community grants5United States Dollar Index maintains position amid safe-haven demand6AUD/USD Price Forecast: Holds above 0.7000; 100-day EMA holds the key ahead of RBA7Silver Price Forecast: XAG/USD awaits move beyond $50.00 to extend recovery from YTD low8New Zealand Dollar weakens following China’s RatingDog Manufacturing PMI data9UKMTO reports two projectiles strike tanker off Saudi Arabia's coast

Boshlang!
Ro‘yxatdan o‘ting va 3 daqiqadan kamroq vaqt ichida Global bozorlariga kirish imkoniga ega bo‘ling

Biz bilan bog‘laning









Kontaktlar
Telefon: +61 2 8036 8388
Faks: +61 2 8036 8388
Email: support@tmgm.com



Ushbu veb-saytda taqdim etilgan ma’lumotlar faqat umumiy xususiyatga ega bo‘lib, shaxsiy moliyaviy maslahat hisoblanmaydi. Ushbu veb-saytdagi har qanday ma’lumot asosida harakat qilishdan oldin, ma’lumotning sizning maqsadlaringiz, moliyaviy ahvolingiz va ehtiyojlaringizga mosligini ko‘rib chiqishingiz kerak. CFD va FX Margin shartnomalariga sarmoya kiritish sezilarli xavflarni o‘z ichiga oladi va barcha investorlar uchun mos emas. Siz boshlang‘ich depozitingizdan ko‘proq yo‘qotishingiz mumkin. Siz asosiy aktivga egalik qilmaysiz va unda hech qanday manfaatga ega emassiz. Savdo qilishdan oldin mustaqil maslahat olishni va ishtirok etuvchi xavflarni to‘liq tushunishingizni tavsiya qilamiz. Veb-saytda keltirilgan har qanday mahsulotni xarid qilishdan oldin oshkor qilish hujjatini o‘qib chiqishingiz va ko‘rib chiqishingiz muhimdir. Ushbu veb-saytda taklif etilgan ma’lumotlar va reklama materiallari bunday foydalanish mahalliy qonunlar va qoidalarga zid bo‘ladigan har qanday mamlakat yoki yurisdiksiyadagi shaxslar tomonidan foydalanish uchun mo‘ljallanmagan. Ushbu veb-saytda taklif etilgan Mahsulotlar va Xizmatlar AQSh, Malayziya va Tailand rezidentlari uchun mo‘ljallanmagan.
TMGM turli yurisdiksiyalarda vakolatli va tartibga solinadi.
Trademax Australia Limited, TMGM nomi ostida faoliyat yuritadi, Avstraliya Qimmatli qog‘ozlar va investitsiyalar komissiyasi (ASIC) tomonidan tartibga solinadi, AFSL raqami 436416 va manzili: Level 28, One International Tower, 100 Barangaroo Avenue, 2000 Sydney, NSW Australia.
Email: support@tmgm.com.au
Trademax Global Limited, TMGM nomi ostida faoliyat yuritadi, Vanuatu Moliyaviy Xizmatlar Komissiyasi (VFSC) tomonidan vakolatli va tartibga solinadi, ro‘yxatga olish raqami 40356 va ro‘yxatdan o‘tgan manzili: 1276, Kumul Highway, Port Vila, Vanuatu, Vanuatu Respublikasi.
Email: support@tmgm.com
Trademax Global Markets (SE) Limited, TMGM nomi ostida faoliyat yuritadi, Seyshel orollari Moliyaviy Xizmatlar Boshqarmasi (FSA) tomonidan 224-sonli SD litsenziyasi bilan vakolatli va tartibga solinadi. Kompaniya Office No 13, Providence Estate ABIS Centre, Mahe, Seychelles manzilida ro‘yxatdan o‘tgan.
Email: support@tmgm.com
Trademax Global Markets (International) Pty Ltd, TMGM nomi ostida faoliyat yuritadi, Mauritius Moliyaviy Xizmatlar Komissiyasi (FSC) tomonidan GB22201012 litsenziya raqami bilan vakolatli va tartibga solinadi hamda 33, Edith Cavell Street C/o IQ EQ Fund Services (Mauritius) Ltd Port Louis, 11324 Mauritius manzilida ro‘yxatdan o‘tgan.
Email: support@tmgm.com
Mualliflik huquqi © TMGM. Barcha huquqlar himoyalangan