

British Pound hits three-week low as US yields, Iran risks weigh
- GBP/USD hits three-week low despite softer US hiring.
- Middle East tensions keep energy-driven inflation risks elevated.
- BoE hearings, Bailey speech and NFP drive next catalysts.
The Pound Sterling fell by some 0.11% and hit a three-week low against the Greenback on Wednesday, even though the US Dollar Index (DXY) is in red territory, following US jobs data that were below estimates but signalled some cooling in the labour market. The GBP/USD trades at 1.3500, after reaching a high of 1.3520.

GBP/USD slips despite softer US jobs data and weaker Dollar
Geopolitical tensions in the Middle East keep energy prices higher, igniting fears for a second round of inflation. In the last two days, the US and Iran exchanged strikes, while US President Donald Trump insisted that Iran is not ready for a deal. Recent headlines revealed that the US State Department paused plans to redeploy diplomatic staff to the Middle East, an indication that talks are off the table.
US data revealed that private hiring in August was softer than forecast at 38K, versus estimates of 47K and down from 44K in July, according to the ADP Employment Change National report.
Even though jobs data was moderately weak, US Treasury yields remain high, boosted in part by Fed Chair Kevin Warsh’s last week's speech at Jackson Hole, in which he recognised that if prices remain high, the Fed has “work to do.”
Across the pond, the UK Finance Minister Healey said that he will present Burnham’s first budget on October 28. He pledged to stick to the borrowing rules set by former minister Rachel Reeves.
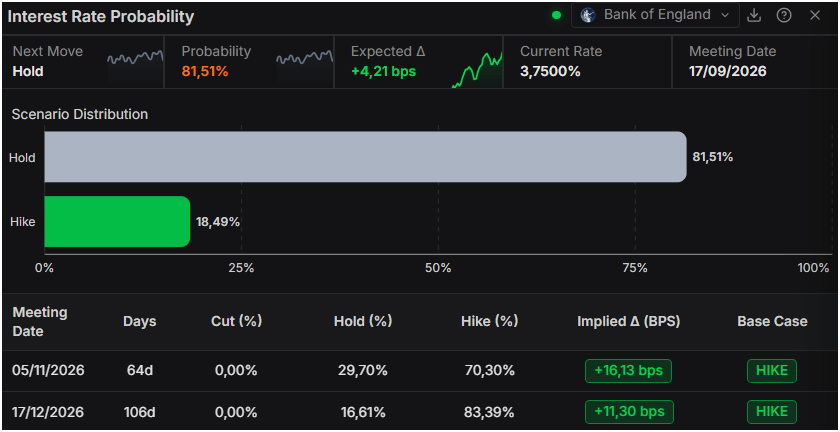
In the meantime, money markets are still seeing a rate hike by the Bank of England (BoE) in December, with investors expecting 32 basis points of tightening towards the end of the year, according to Prime Terminal.
Ahead of the UK economic schedule, the BoE Monetary Policy Hearing and a speech by the BoE’s Governor, Andrew Bailey, will feature. In the US, the docket will feature jobs data, the ISM Services PMI for August, and will end the week with the awaited Nonfarm Payrolls report.
GBP/USD Price Forecast: Technical outlook
In the daily chart, GBP/USD trades at 1.3495. The pair holds a modestly constructive bias as it trades above the simple moving average triple around 1.3442, suggesting underlying demand remains intact despite the recent pullback from the highs. Momentum has cooled, with the 14-period Relative Strength Index slipping toward the mid-40s, hinting at consolidative rather than impulsive downside pressure while price compresses between former trend structures.
On the topside, immediate resistance emerges near 1.3508 at the first descending trend line, with the next cap seen around 1.3544 from the more recent downtrend; a break above these levels would expose former rising trend supports now turned resistance near 1.3606 and 1.3631. On the downside, initial support is provided by the clustered simple moving averages around 1.3442; a daily close below this zone would weaken the current constructive tone and open the door to a deeper correction toward lower levels not yet in play on the present chart.
(The technical analysis of this story was written with the help of an AI tool. Know more.)
Pound Sterling Price Today
The table below shows the percentage change of British Pound (GBP) against listed major currencies today. British Pound was the strongest against the New Zealand Dollar.
| USD | EUR | GBP | JPY | CAD | AUD | NZD | CHF | |
|---|---|---|---|---|---|---|---|---|
| USD | 0.05% | 0.16% | -0.83% | -0.37% | -0.33% | 0.81% | 0.19% | |
| EUR | -0.05% | 0.11% | -0.87% | -0.41% | -0.37% | 0.74% | 0.15% | |
| GBP | -0.16% | -0.11% | -0.96% | -0.52% | -0.49% | 0.61% | 0.04% | |
| JPY | 0.83% | 0.87% | 0.96% | 0.45% | 0.49% | 1.61% | 1.01% | |
| CAD | 0.37% | 0.41% | 0.52% | -0.45% | 0.04% | 1.16% | 0.56% | |
| AUD | 0.33% | 0.37% | 0.49% | -0.49% | -0.04% | 1.12% | 0.53% | |
| NZD | -0.81% | -0.74% | -0.61% | -1.61% | -1.16% | -1.12% | -0.58% | |
| CHF | -0.19% | -0.15% | -0.04% | -1.01% | -0.56% | -0.53% | 0.58% |
The heat map shows percentage changes of major currencies against each other. The base currency is picked from the left column, while the quote currency is picked from the top row. For example, if you pick the British Pound from the left column and move along the horizontal line to the US Dollar, the percentage change displayed in the box will represent GBP (base)/USD (quote).














