
News & AnalysisCareer

Trading at around $4,065 at the time of writing, Gold (XAU/USD) is down 0.81% on Friday after touching an intraday low of $4,035. The metal remains under pressure below $4,100, having reached a two-week peak of $4,146 the day before. A recovering US Dollar (USD) is weighing on prices as markets await the US Nonfarm Payrolls report at 13:30 GMT.

October’s US employment figures are forecast to show 65K new jobs, compared with 29K in September, alongside an unchanged Unemployment Rate of 4.2%. An upside surprise would suggest the labour market remains steady, allowing the Federal Reserve (Fed) greater scope to continue its fight against inflation.
Expectations of a December interest rate rise could consequently strengthen, supporting the US Dollar and adding to the pressure on Gold. Weaker figures, by contrast, could curb those expectations and weigh on the Greenback, giving bullion scope to recover.
At around 102.00, the US Dollar Index (DXY) is 0.40% higher on the day. The index measures the Greenback against a basket of six major currencies.
As the AI-led equity sell-off intensifies, investors are reducing positions to free up cash, meet margin calls or offset losses elsewhere. That leaves Gold exposed to selling prompted by liquidity needs.
Despite this pressure, a steep fall in oil prices is helping bullion remain on course to end a three-week run of losses. West Texas Intermediate (WTI) has fallen around 12% so far this week. The Democratic sweep of Congress in the US midterm elections has raised expectations that lawmakers could rein in President Donald Trump’s military campaign against Iran.
Diplomatic efforts continue, but a negotiated resolution to the US-Iran war still looks distant. A partial recovery in oil prices is also constraining Gold’s gains. US President Donald Trump said the US may have to “destroy” the rest of Iran and that people will “know soon enough” whether he will take action.
Since the war started in late February, crude prices and their implications for inflation and interest rates have played a central role in bullion’s performance. Rising energy costs have increased the pressure on central banks to tighten monetary policy, to the detriment of the non-yielding metal.
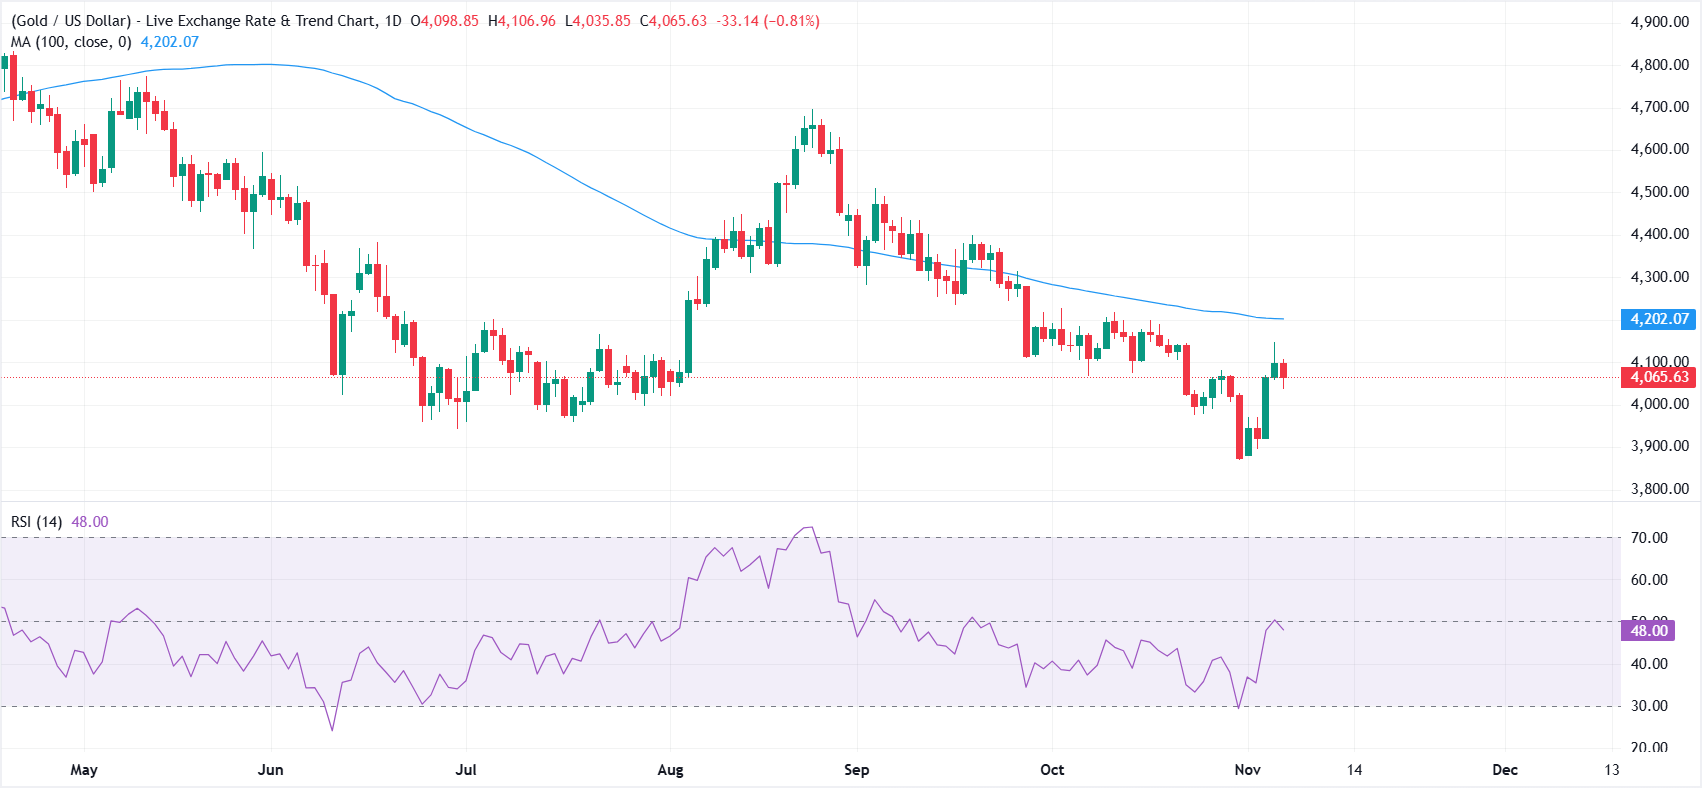
Today’s percentage moves in the US Dollar (USD) against the major currencies listed are set out below. The US Dollar recorded its strongest performance against the New Zealand Dollar.
| USD | EUR | GBP | JPY | CAD | AUD | NZD | CHF | |
|---|---|---|---|---|---|---|---|---|
| USD | 0.39% | 0.41% | 0.28% | 0.38% | 0.85% | 0.93% | 0.11% | |
| EUR | -0.39% | 0.02% | -0.09% | -0.00% | 0.46% | 0.53% | -0.29% | |
| GBP | -0.41% | -0.02% | -0.11% | -0.02% | 0.45% | 0.51% | -0.31% | |
| JPY | -0.28% | 0.09% | 0.11% | 0.11% | 0.57% | 0.64% | -0.18% | |
| CAD | -0.38% | 0.00% | 0.02% | -0.11% | 0.46% | 0.53% | -0.28% | |
| AUD | -0.85% | -0.46% | -0.45% | -0.57% | -0.46% | 0.07% | -0.74% | |
| NZD | -0.93% | -0.53% | -0.51% | -0.64% | -0.53% | -0.07% | -0.80% | |
| CHF | -0.11% | 0.29% | 0.31% | 0.18% | 0.28% | 0.74% | 0.80% |
Percentage movements between the major currencies are displayed in the heat map. Select the base currency in the left-hand column and the quote currency in the top row. For instance, choosing the US Dollar on the left and following its row across to the Japanese Yen gives the percentage change for USD (base)/JPY (quote) in the corresponding cell.







Phone: +61 2 8036 8388
Fax: +61 2 8036 8388
Email: support@tmgm.com



The information provided on this website is of a general nature only and does not constitute personal financial advice. Before acting on any information on this website, you should consider the suitability of the information in relation to your objectives, financial situation and needs. Investing in CFDs and FX Margin Contracts carries significant risks and is not suitable for all investors. You may lose more than your initial deposit. You do not own, or have, any interest in the underlying asset. We recommend that you seek independent advice and ensure you fully understand the risks involved before trading. It is important that you read and consider the disclosure document before you acquire any product listed on the website. The information and advertisements offered on this website are not intended for use by any person in any country or jurisdiction where such use would be contrary to local laws and regulations. The Products and Services offered on this website are not intended for residents of the United States, Malaysia and Thailand.
TMGM is authorized and regulated in various jurisdictions.
Trademax Australia Limited, trading as TMGM, is regulated by the Australian Securities and Investments Commission (ASIC), AFSL no. 436416 and is located at Level 28, One International Tower, 100 Barangaroo Avenue, 2000 Sydney, NSW Australia.
Email: support@tmgm.com.au
Trademax Global Limited, trading as TMGM, is authorized and regulated by the Vanuatu Financial Services Commission (VFSC), registration number 40356 and registered at 1276, Kumul Highway, Port Vila, Vanuatu, Republic of Vanuatu.
Email: support@tmgm.com
Trademax Global Markets (SE) Limited, trading as TMGM, is authorized and regulated by the Financial Services Authority (FSA) of Seychelles, with license number SD224. The company is registered at Office No 13, Providence Estate ABIS Centre, Mahe, Seychelles.
Email: support@tmgm.com
Trademax Global Markets (International) Pty Ltd, trading as TMGM, is authorized and regulated by the Financial Services Commission, Mauritius (FSC) with license no. GB22201012, and registered at 33, Edith Cavell Street C/o IQ EQ Fund Services (Mauritius) Ltd Port Louis, 11324 Mauritius.
Email: support@tmgm.com
Copyright © TMGM. All rights reserved

