

Trading
Explore a wide range of markets with competitive pricing, deep liquidity, and advanced trading tools.
Learn More 
Platform
Trade seamlessly with TMGM's powerful platform, built for speed, precision, and a superior trading experience.
Learn More Trading Platform
Academy
Learn the fundamentals of trading with beginner-friendly resources, including guides, webinars, and market insights.
Learn More News & Analysis
Get real-time market updates and expert analysis to stay ahead of trading opportunities
Learn More News & Analysis
About
Learn what sets TMGM apart — our global presence, regulatory strength, and commitment to innovation in trading.
Learn More Why Choose TMGM
Sponsorship
US NFP data ahead: Australian Dollar tumbles against US Dollar
- Broad US Dollar strength sends the Australian Dollar sliding towards 0.6862.
- Safe-haven buying supports the US Dollar as AI stocks suffer a global rout.
- September US NFP figures remain firmly on investors’ radar.
Heavy selling weighs on the Australian Dollar (AUD) against the US Dollar (USD) on Friday, with AUD/USD touching a new seven-month low of 0.6862 during European trading.
Demand for safety amid a worldwide sell-off in Artificial Intelligence (AI) infrastructure shares is driving the US Dollar’s outperformance and dragging the Aussie pair sharply lower.

How Is the US Dollar Performing Today?
The US Dollar recorded its strongest performance against the New Zealand Dollar today. The table below sets out the percentage moves in the US Dollar (USD) against the major currencies listed.
| USD | EUR | GBP | JPY | CAD | AUD | NZD | CHF | |
|---|---|---|---|---|---|---|---|---|
| USD | 0.36% | 0.38% | 0.30% | 0.36% | 0.85% | 0.91% | 0.15% | |
| EUR | -0.36% | 0.02% | -0.07% | 0.00% | 0.50% | 0.56% | -0.21% | |
| GBP | -0.38% | -0.02% | -0.06% | -0.02% | 0.48% | 0.54% | -0.23% | |
| JPY | -0.30% | 0.07% | 0.06% | 0.07% | 0.56% | 0.61% | -0.15% | |
| CAD | -0.36% | -0.00% | 0.02% | -0.07% | 0.49% | 0.54% | -0.22% | |
| AUD | -0.85% | -0.50% | -0.48% | -0.56% | -0.49% | 0.05% | -0.70% | |
| NZD | -0.91% | -0.56% | -0.54% | -0.61% | -0.54% | -0.05% | -0.74% | |
| CHF | -0.15% | 0.21% | 0.23% | 0.15% | 0.22% | 0.70% | 0.74% |
Percentage movements between the major currencies are displayed in the heat map. Select the base currency in the left-hand column and the quote currency in the top row. For instance, choosing the US Dollar on the left and following that row across to the Japanese Yen gives the percentage change for USD (base)/JPY (quote) in the corresponding cell.
Trading near 102.00 at the time of writing, the US Dollar Index (DXY) is up 0.42%. The index measures the Greenback against a basket of six major currencies.
Can the Dollar sustain its post-election recovery as tighter US conditions increase downside risks?
The dollar’s resilience despite tighter US financial conditions is evident in its recovery, according to MUFG analysts. They say the episode “has resulted in the dollar index reversing all of its initial losses since the US mid-term election results were announced,” although the “spillover impact from the AI-related equity market sell-off into the foreign exchange market has remained surprisingly modest so far.”
Following Wednesday’s US midterm election outcome, which gave Democrats a majority in both the House and the Senate, the USD Index dropped to a new monthly low around 101.00.
According to MUFG, “US dollar strength this year has been supported by higher energy prices and record foreign demand for riskier US assets.” The bank nevertheless cautions that “if both these drivers continue to reverse, it would increase the likelihood of the US dollar weakening,” especially should appetite for US assets deteriorate further. It also warns that “if financial conditions continue to tighten it could make it less likely that the Federal Reserve (Fed) will hike again in December as planned thereby adding to downside risks for the US Dollar.”
Investors are looking to October’s US Nonfarm Payrolls (NFP) release, due at 13:30 GMT, for further indications of the Fed’s monetary policy trajectory.
Expectations for the US NFP report point to 65K new jobs, compared with 29K in September, while the Unemployment Rate is projected to remain unchanged at 4.2%.
For the Australian Dollar, attention centres on whether the Reserve Bank of Australia (RBA) will raise interest rates again this year. Five quarter-percentage-point increases so far in 2026 have taken the Official Cash Rate (OCR) to 4.85%.
Although the RBA raised rates this week, its messaging indicated reluctance over additional tightening. RBA Governor Michele Bullock said, “Voters favoring pause perceived greater downside risks,” and added, “Those favoring a hold wanted to wait longer for data.” She also said, “Not definitely hiking rates again, preserving options.”
AUD/USD Technical Analysis: Can Support Contain Further Losses?
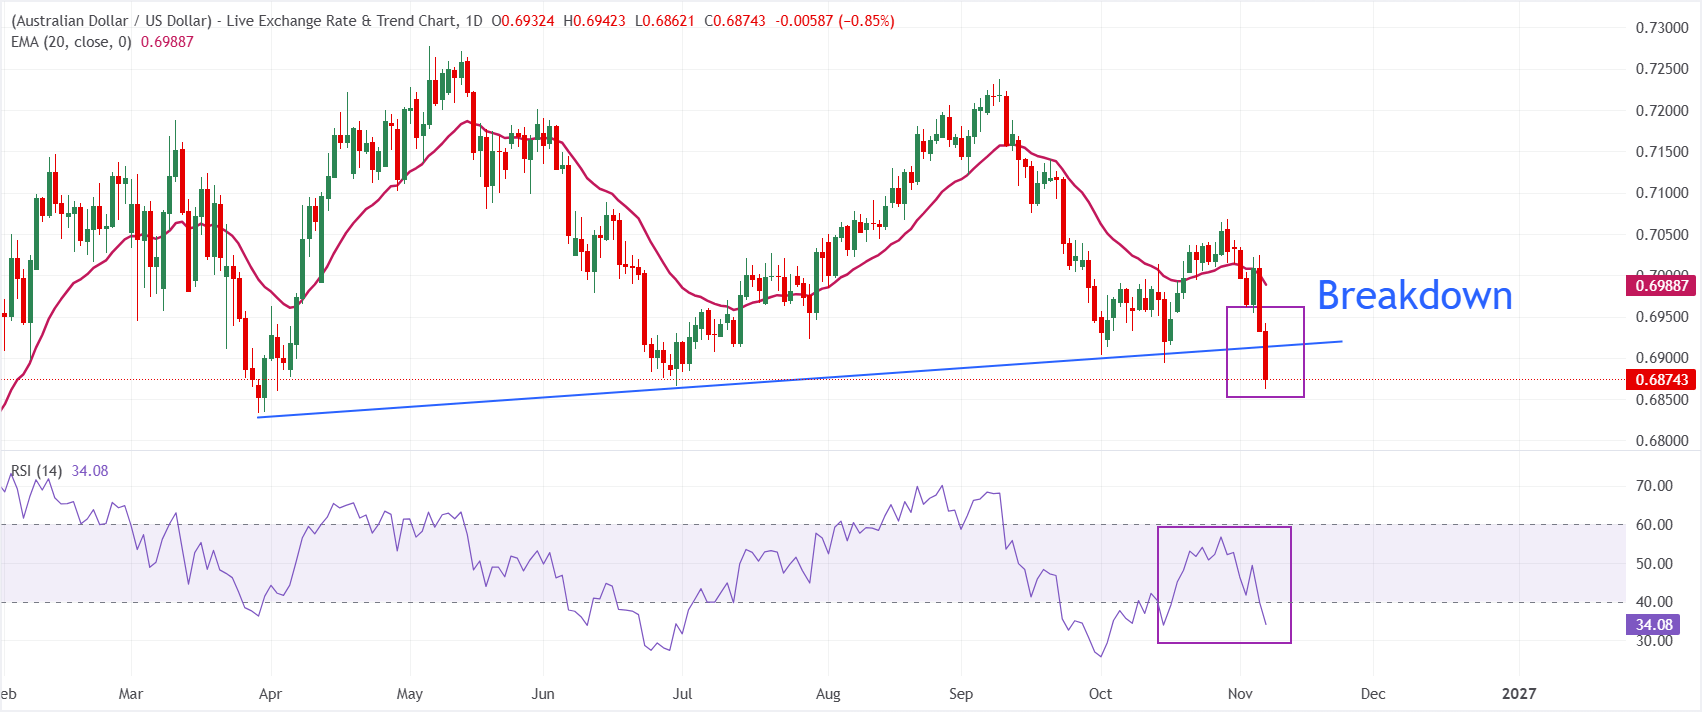
A bearish short-term outlook persists for AUD/USD, which is trading at 0.6874 on the daily chart. The pair remains below both the 20-period exponential moving average (EMA) at 0.6989 and the former trend-line support, now resistance, near 0.6913. These overhead barriers continue to weigh on price action. At 34, the Relative Strength Index (14) signals weak, though not extreme, bearish momentum, suggesting that sellers retain control despite the recent slowdown.
The broken rising trend line near 0.6913 provides the first upside hurdle, ahead of the 20-day EMA at 0.6989. As long as that average remains above the price, it reinforces the broader bearish structure. On the downside, the earlier trend-line anchor around 0.6828 offers nearby structural support. A clear breach would leave scope for additional declines; staying above it would indicate only consolidation in a market still constrained by overhead resistance.
(The technical analysis of this story was written with the help of an AI tool. Know more.)
Economic Data in Focus
What Do Nonfarm Payrolls Measure?
Published by the US Bureau of Labor Statistics (BLS), the Nonfarm Payrolls release reports how many new jobs were added across US non-agricultural businesses in the preceding month. Monthly payroll changes can fluctuate sharply, and substantial revisions to the figures can also fuel volatility in the Forex market. A strong reading is generally regarded as positive for the US Dollar (USD), whereas a weak figure is viewed as negative. However, revisions to earlier months and the Unemployment Rate carry as much significance as the headline number. The market response therefore rests on investors’ assessment of the full set of data in the BLS report.
Explore further.Upcoming release: Fri 06 Nov 2026 13:30
Release frequency: Monthly
Consensus estimate: 65K
Prior reading: 29K
Data source: US Bureau of Labor Statistics
Substantial currency-market volatility can follow America’s monthly jobs report, with readings above consensus generally supporting the USD. Forex traders regard the report as the most important economic indicator. Published on the first Friday after the month under review, it tracks the change in employment, which is closely linked to the economy’s overall performance and watched by policymakers. As full employment is one of the Federal Reserve’s mandates, labour-market developments inform its policy decisions, which in turn affect currencies. Although several leading indicators help shape forecasts, Nonfarm Payrolls frequently catch markets by surprise.
POPULAR ARTICLES
1Asia FX: Tech-led risk aversion puts currencies under pressure ahead of NFP – MUFG2Russia Central Bank Reserves $ registered at $721.6B above expectations ($0B)3US Dollar: Range holds as payrolls provide support – ING4BoE's Pill: Stalling growth next year would leave Bank rate unchanged or even lead to a cut5US Dollar Index (DXY) scales weekly highs above 102.00 as October's NFP release approaches6Norwegian Krone: Oil Risks Take Centre Stage as Policy Holds Steady – Commerzbank7EUR/GBP Price Forecast: Narrow trading range persists after five straight weeks of losses8New Zealand Dollar slips to 19-month lows at 0.5540 ahead of NFP data9US Dollar: Upside constrained by risk repricing – DBS


Get Started!
Sign up and access the Global Markets in less than 3 minutes

Connect With Us









Contacts
Phone: +61 2 8036 8388
Fax: +61 2 8036 8388
Email: support@tmgm.com



The information provided on this website is of a general nature only and does not constitute personal financial advice. Before acting on any information on this website, you should consider the suitability of the information in relation to your objectives, financial situation and needs. Investing in CFDs and FX Margin Contracts carries significant risks and is not suitable for all investors. You may lose more than your initial deposit. You do not own, or have, any interest in the underlying asset. We recommend that you seek independent advice and ensure you fully understand the risks involved before trading. It is important that you read and consider the disclosure document before you acquire any product listed on the website. The information and advertisements offered on this website are not intended for use by any person in any country or jurisdiction where such use would be contrary to local laws and regulations. The Products and Services offered on this website are not intended for residents of the United States, Malaysia and Thailand.
TMGM is authorized and regulated in various jurisdictions.
Trademax Australia Limited, trading as TMGM, is regulated by the Australian Securities and Investments Commission (ASIC), AFSL no. 436416 and is located at Level 28, One International Tower, 100 Barangaroo Avenue, 2000 Sydney, NSW Australia.
Email: support@tmgm.com.au
Trademax Global Limited, trading as TMGM, is authorized and regulated by the Vanuatu Financial Services Commission (VFSC), registration number 40356 and registered at 1276, Kumul Highway, Port Vila, Vanuatu, Republic of Vanuatu.
Email: support@tmgm.com
Trademax Global Markets (SE) Limited, trading as TMGM, is authorized and regulated by the Financial Services Authority (FSA) of Seychelles, with license number SD224. The company is registered at Office No 13, Providence Estate ABIS Centre, Mahe, Seychelles.
Email: support@tmgm.com
Trademax Global Markets (International) Pty Ltd, trading as TMGM, is authorized and regulated by the Financial Services Commission, Mauritius (FSC) with license no. GB22201012, and registered at 33, Edith Cavell Street C/o IQ EQ Fund Services (Mauritius) Ltd Port Louis, 11324 Mauritius.
Email: support@tmgm.com
Copyright © TMGM. All rights reserved