

Trading
Explore a wide range of markets with competitive pricing, deep liquidity, and advanced trading tools.
Learn More 
Platform
Trade seamlessly with TMGM's powerful platform, built for speed, precision, and a superior trading experience.
Learn More Trading Platform
Academy
Learn the fundamentals of trading with beginner-friendly resources, including guides, webinars, and market insights.
Learn More News & Analysis
Get real-time market updates and expert analysis to stay ahead of trading opportunities
Learn More News & Analysis
About
Learn what sets TMGM apart — our global presence, regulatory strength, and commitment to innovation in trading.
Learn More Why Choose TMGM
Sponsorship
Crypto Today: Brief rebound leaves Bitcoin, Ethereum, XRP holding on to gains
- Bulls gradually regain ground as Bitcoin's recovery picks up pace above $83,000.
- A firm cluster of medium- to long-term moving averages supports Ethereum's modest advance.
- With XRP approaching $1.35, buyers strengthen their hold in a bid to keep the trend under their control.
A broadly positive tone prevails across cryptocurrencies on Wednesday as Bitcoin (BTC) holds above $83,000. Major altcoins Ethereum (ETH) and Ripple (XRP) lead a similar advance. Trading around $2,455, ETH, the largest smart contract token, is gaining for a second consecutive day, while XRP edges up towards $1.35.

In its weekly Ahead of The Curve report, K33 Research said, “Bitcoin spent another week in tight consolidation with shrinking volumes, soft derivatives activity and narrowing volatility,” adding, “Price kept drifting lower and briefly dipped below $80,000 on Thursday as equities sold off on a hot Consumer Price Index (CPI) print and a steep semiconductor sell-off.”
Is risk appetite finding a firmer footing?
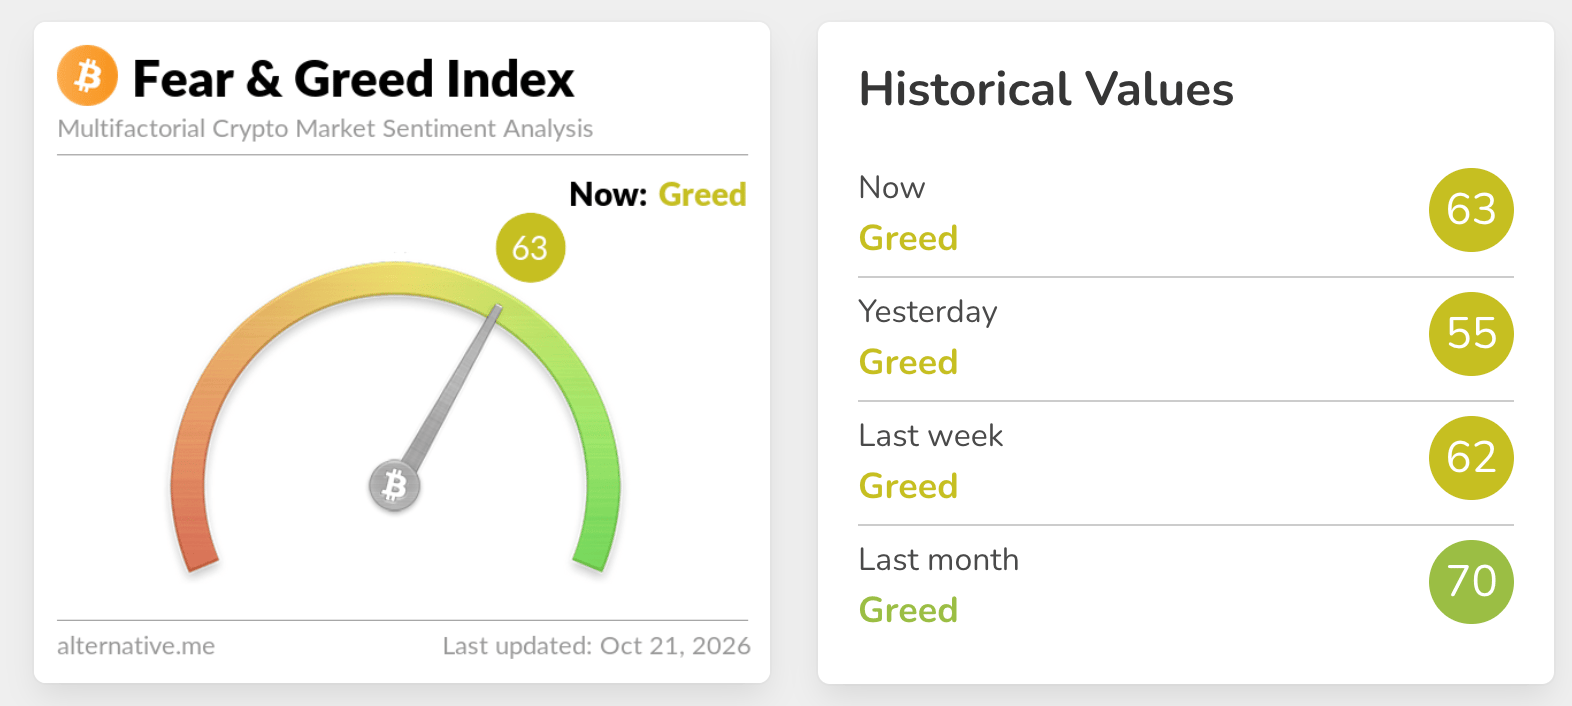
Investors continue to show a strong appetite for digital assets despite macroeconomic pressures on the wider crypto market. On Wednesday, the Fear & Greed Index stands at 63 in Greed territory, compared with 55 a day earlier. The increase indicates a willingness to take greater risks in anticipation of the uptrend resuming.
Capital flows remain mixed, according to SoSoValue data. Tuesday brought $23 million in inflows into Bitcoin spot Exchange-Traded Funds (ETFs), sharply below Monday's $527 million. Ethereum spot ETFs, by contrast, registered outflows of $26 million on Tuesday, prolonging a bearish run spanning five days.
Activity in XRP spot ETFs has also been uneven: last week's Thursday and Friday saw outflows of $105,000 and $2.5 million respectively, followed by used activity on Monday and Tuesday.
The K33 report also noted, “Low participation remains the dominant theme, and we still view this regime as similar to the dormant 2023 recovery,”
Technical analysis: Can Bitcoin extend its advance?
Holding above its key Exponential Moving Averages (EMAs), Bitcoin retains a bullish short-term bias at $83,187. Beneath the spot price are the 50-day EMA around $80,780, the 100-day EMA near $77,343 and the 200-day EMA near $76,098. Their positioning points to an underlying uptrend, with additional backing from the SuperTrend line at about $79,664.
The momentum picture is less clear-cut. A Relative Strength Index (RSI) reading above 53 suggests mild bullish pressure, but the Moving Average Convergence Divergence (MACD) is still negative. Together, these signals suggest that gains remain gradual rather than forceful.
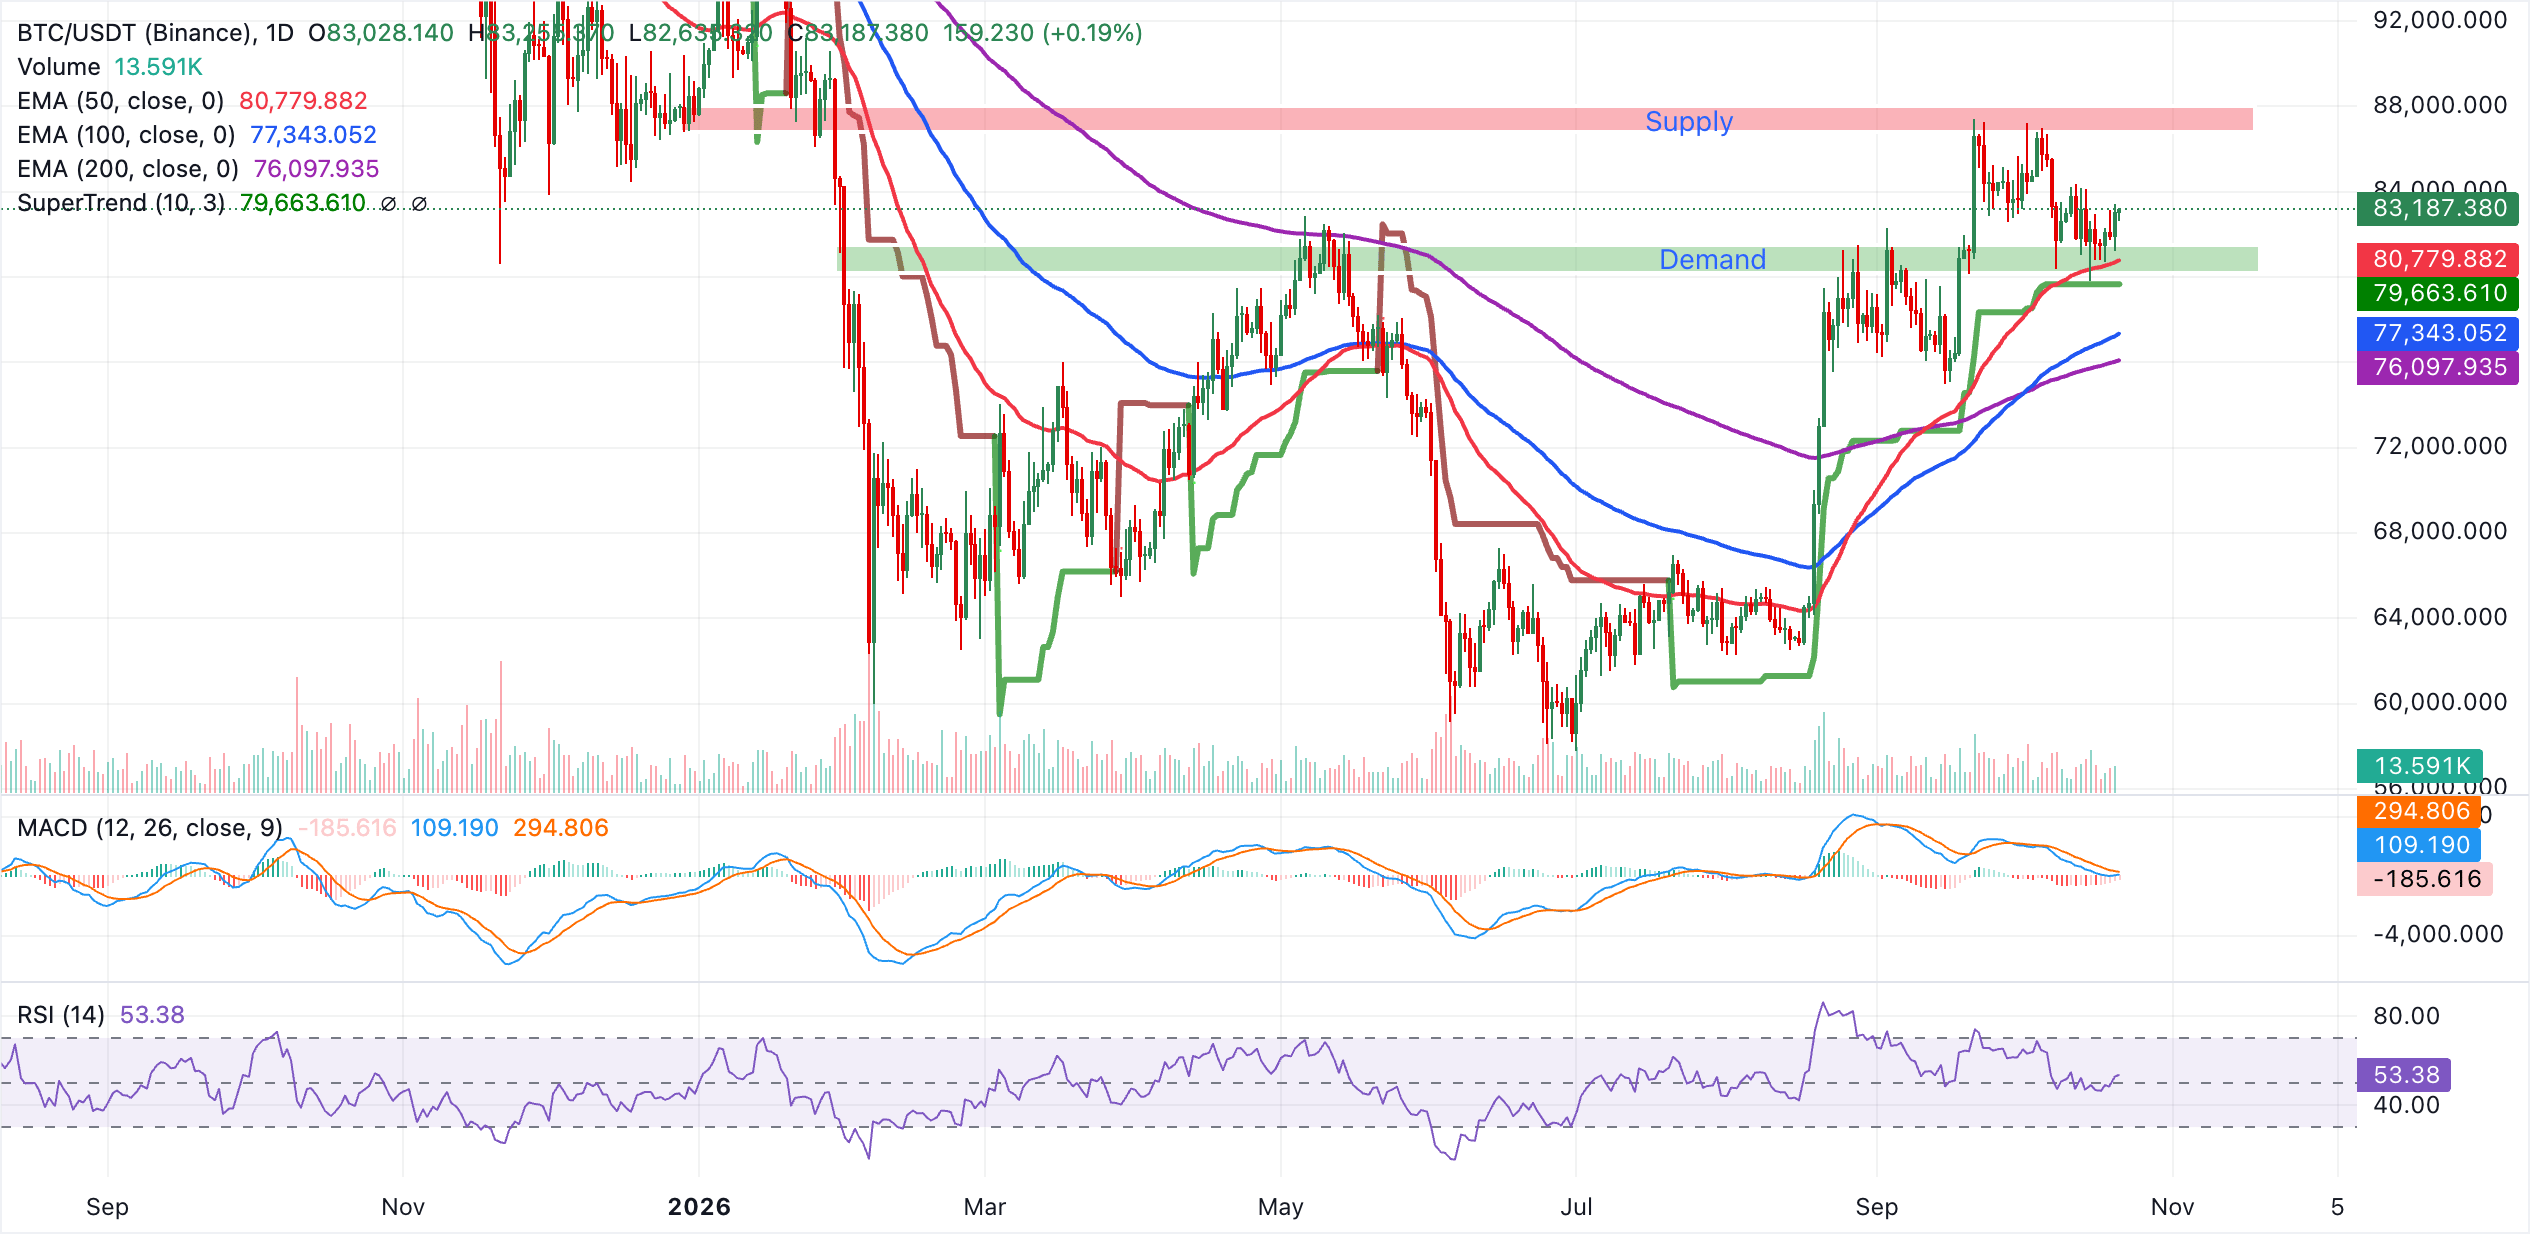
The first downside cushion is the 50-day EMA at $80,780; a larger pullback would bring the SuperTrend level at $79,664 into focus as secondary support. Further below, the 100-day EMA at $77,343 and the 200-day EMA at $76,098 create a wider demand zone where buyers would be expected to emerge during a sharper correction.
The daily chart flags no immediate indicator-based resistance overhead, leaving price action itself likely to guide any further advance. Continued respect for the layered EMA support zone, alongside a stabilising MACD and a gradually rising RSI, would signal a sustained move higher in BTC.
Altcoin technical outlook: Can Ethereum and XRP restart their bullish trends?
At $2,455, Ethereum remains caught between important moving averages. Support from the 100-day EMA at $2,363 and the 200-day EMA at $2,307 preserves the broader constructive setup, while the 50-day EMA at $2,481 and the SuperTrend line at $2,676 limit the upside. With medium-term support holding but short-term trend resistance yet to be reclaimed, the near-term bias is neutral to mildly bearish.
This lack of conviction is also evident in momentum readings. The RSI is near a neutral 44 and the MACD remains below zero, suggesting that recovery attempts could attract selling unless Ethereum breaks decisively above the 50-day EMA.
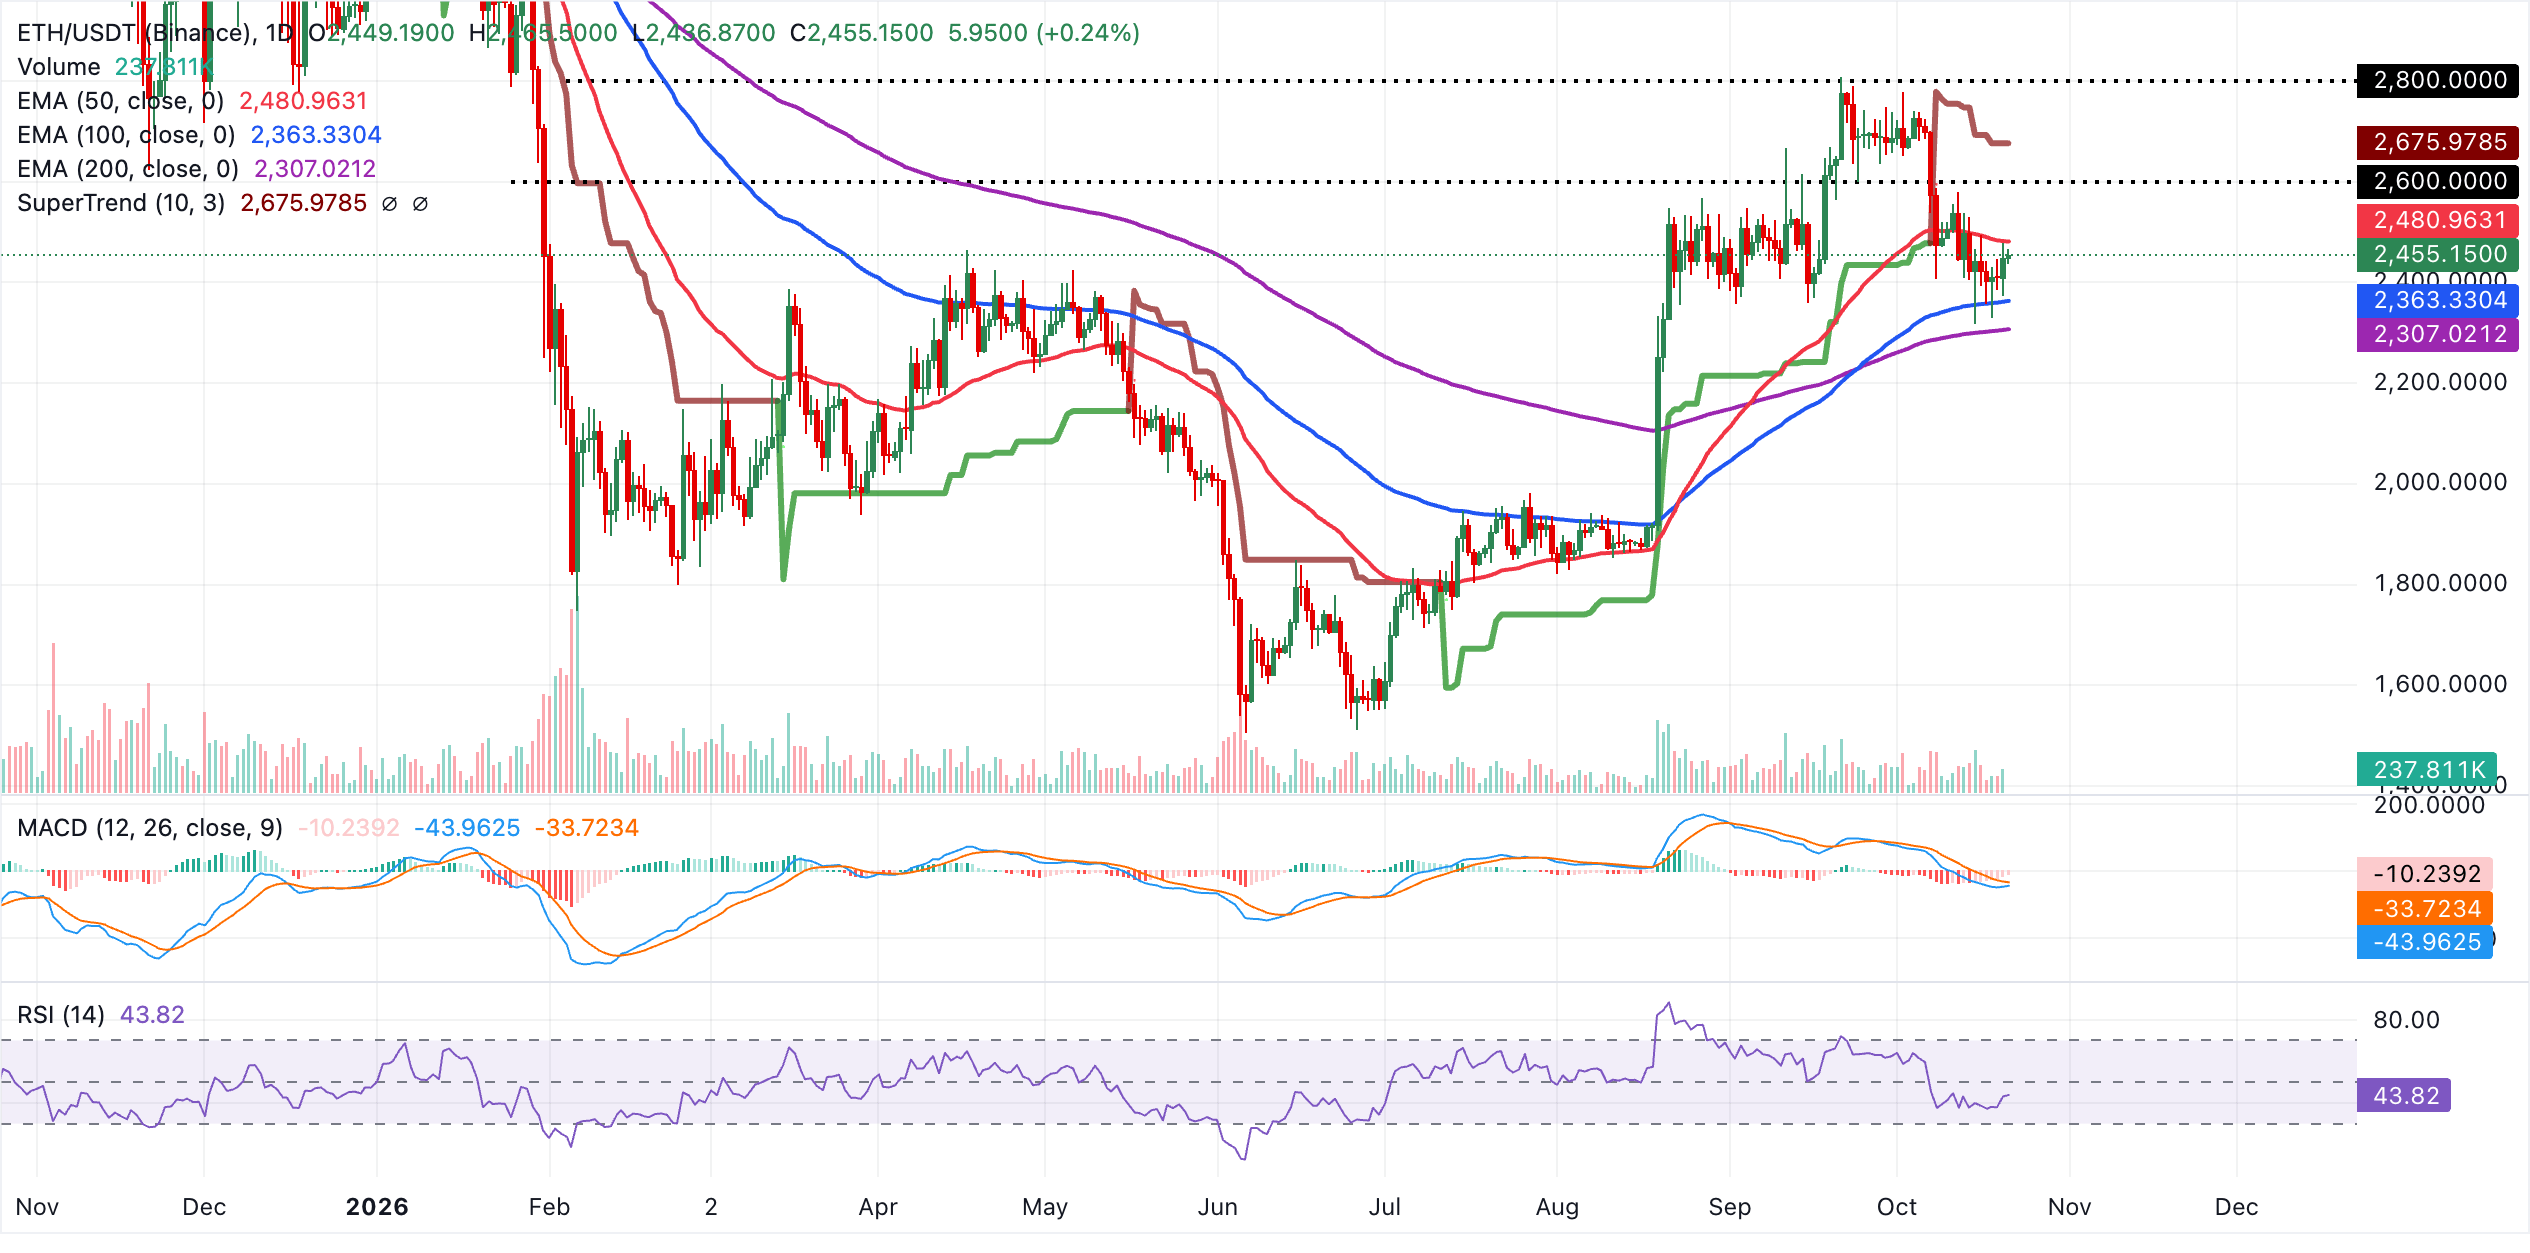
A more convincing recovery first requires a break through the 50-day EMA at $2,481, the immediate resistance level. Beyond it, the SuperTrend line near $2,676 presents a tougher hurdle. Support on a decline begins at the 100-day EMA at $2,363, followed by the more substantial structural floor at the 200-day EMA around $2,307. Closing below the latter on a daily basis would materially undermine the bullish undertone of the larger trend and leave the pair vulnerable to additional losses.
For XRP, trading at $1.34, the short-term upside remains restricted by the 50-day and 200-day EMAs around $1.38. Although the token has regained the 100-day EMA at $1.34 as immediate support, the descending resistance trend line near $1.70 and the SuperTrend line at $1.47 continue to constrain the wider structure.
Momentum readings reinforce the limited-upside picture rather than signalling a clear bullish reversal. The MACD's reading remains negative and below zero, while the RSI is around 44, pointing to restrained buying interest.
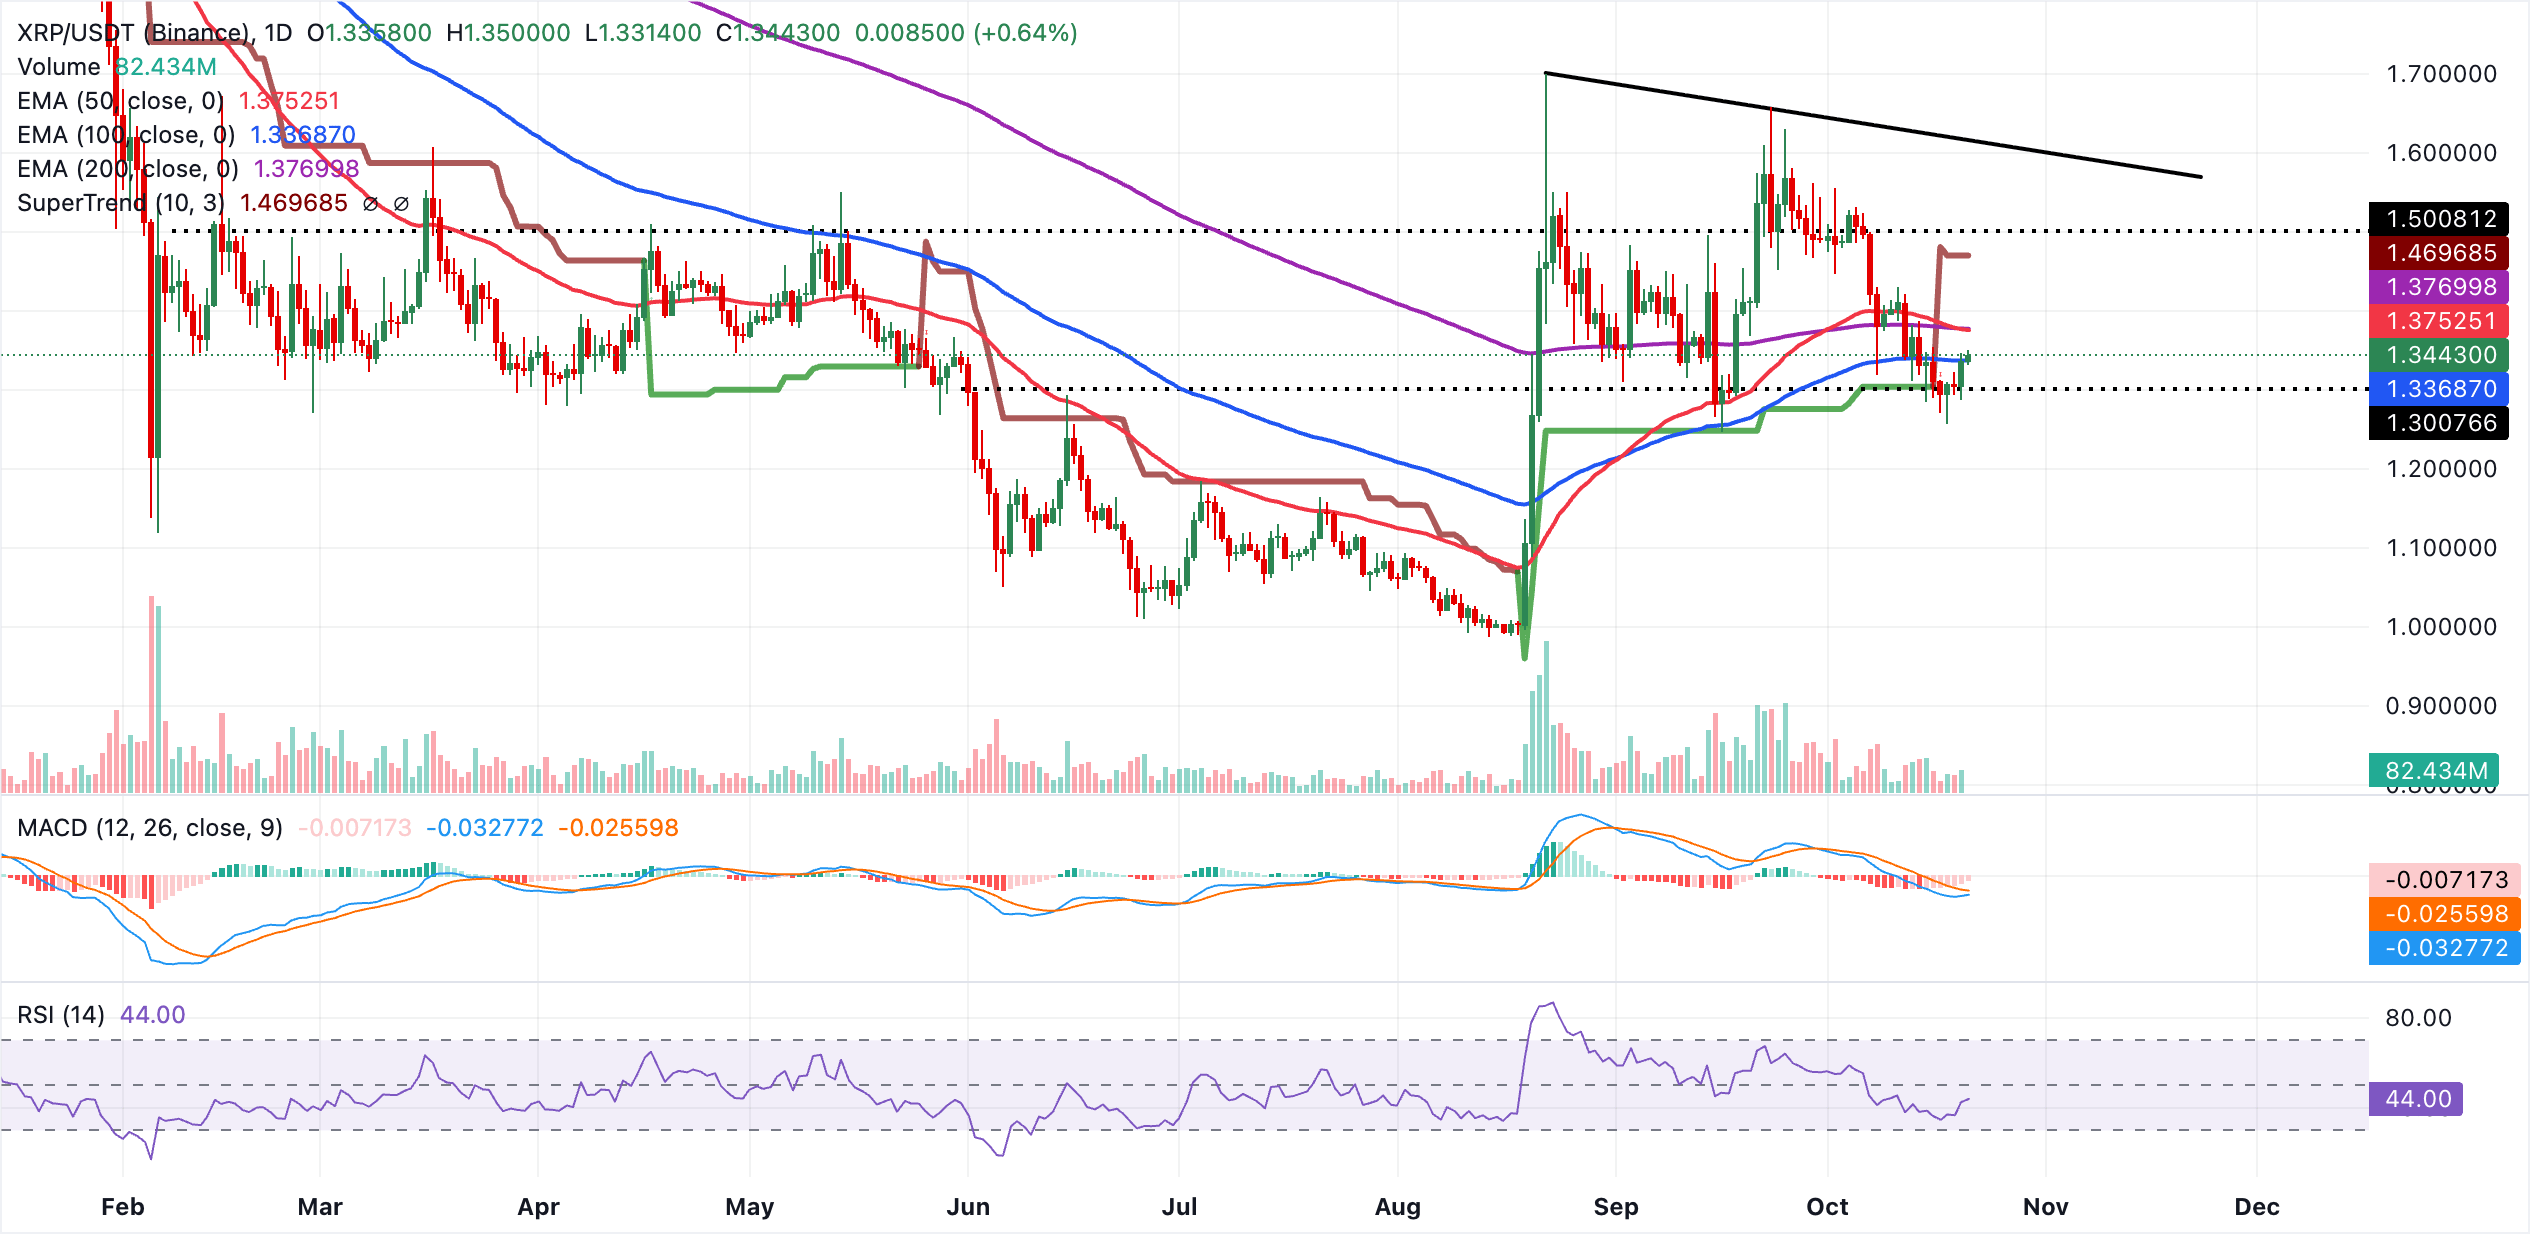
The 50-day EMA at $1.38 provides the first resistance, with the 200-day EMA at $1.38 close alongside it. Clearing this compact resistance cluster is necessary to create room for a move towards the SuperTrend barrier at $1.47 and, later, the broader descending trendline above that area.
The 100-day EMA at $1.34 offers the nearest downside support. If XRP records a daily close below it, deeper consolidation would become possible and the bearish bias would strengthen, provided the price remains under the higher EMAs and the prevailing downtrend line.
(The technical analysis of this story was written with the help of an AI tool. Know more.)
What drives cryptocurrency prices? FAQs
Demand and adoption among market participants are shaped by token launches. When an asset is listed on a crypto exchange, its liquidity improves and new participants join its network. These developments are generally positive for the digital asset's price.
In a hack, an attacker uses exploits, bugs or other methods to seize a substantial quantity of an asset from a DeFi bridge, an exchange's hot wallet or another crypto platform. The stolen tokens are then moved off exchange platforms, ultimately to be sold or exchanged for other cryptocurrencies or stablecoins. Widespread panic often follows such incidents, prompting a sell-off in the affected assets.
The direct effect on the US Dollar is the main channel through which macroeconomic events, such as the US Federal Reserve's interest rate decision, influence crypto assets. Higher interest rates usually weigh on Bitcoin and altcoin prices, while lower rates generally have the opposite effect. A decline in the US Dollar index makes risk assets and the leverage used to trade them cheaper, thereby lifting crypto prices.
By cutting miners' block rewards in half, halvings restrict the asset's supply and are therefore generally viewed as bullish events. With demand unchanged, a reduction in supply pushes the asset's price higher.
POPULAR ARTICLES
1Gold Price Forecast: XAU/USD Slides to Lows Near $4,110 as Oil and Yields Rise2Crypto Today: Brief rebound leaves Bitcoin, Ethereum, XRP holding on to gains3Credit crisis fears grow as France’s 10-year bond yield rises above 5%4Euro: How are France risks and ECB expectations keeping EUR/USD steady? – Commerzbank5New Zealand Dollar: With CPI Close to Forecast, RBNZ Rate Hike Expected – ING6Silver price today: FXStreet data shows a decline7British Pound: Does Surging Inflation Support a November BoE Hike? – BBH8GBP/USD Price Forecast: Is a fresh upward move unfolding above 1.3410?9South African Rand: Can gains against US Dollar hold? – Societe Generale
LIVE QUOTES


ALL ABOUT TECHNICAL
What Is a Judas Swing? ICT Trading Strategy Explained With Examples
The Real Interest Rate: Are Your Savings Actually Earning Anything?
Butterfly Pattern Trading: How to Identify and Trade the Butterfly Harmonic Pattern
What Is a Rising Wedge Pattern and How Do You Trade It?
What Is a Descending Triangle Pattern and How Do You Trade It?
Accumulation, Manipulation and Distribution (AMD): ICT Power of 3 Trading Guide
How to Read the CPI Report Before You Trade It: A Trader's Guide to Headline and Core
Slippage, Spread and Gaps: Why Your Fill Differs From the Price You Saw
Backtesting in Trading: What It Is and How to Backtest a Strategy
Get Started!
Sign up and access the Global Markets in less than 3 minutes

Connect With Us









Contacts
Phone: +61 2 8036 8388
Fax: +61 2 8036 8388
Email: support@tmgm.com



The information provided on this website is of a general nature only and does not constitute personal financial advice. Before acting on any information on this website, you should consider the suitability of the information in relation to your objectives, financial situation and needs. Investing in CFDs and FX Margin Contracts carries significant risks and is not suitable for all investors. You may lose more than your initial deposit. You do not own, or have, any interest in the underlying asset. We recommend that you seek independent advice and ensure you fully understand the risks involved before trading. It is important that you read and consider the disclosure document before you acquire any product listed on the website. The information and advertisements offered on this website are not intended for use by any person in any country or jurisdiction where such use would be contrary to local laws and regulations. The Products and Services offered on this website are not intended for residents of the United States, Malaysia and Thailand.
TMGM is authorized and regulated in various jurisdictions.
Trademax Australia Limited, trading as TMGM, is regulated by the Australian Securities and Investments Commission (ASIC), AFSL no. 436416 and is located at Level 28, One International Tower, 100 Barangaroo Avenue, 2000 Sydney, NSW Australia.
Email: support@tmgm.com.au
Trademax Global Limited, trading as TMGM, is authorized and regulated by the Vanuatu Financial Services Commission (VFSC), registration number 40356 and registered at 1276, Kumul Highway, Port Vila, Vanuatu, Republic of Vanuatu.
Email: support@tmgm.com
Trademax Global Markets (SE) Limited, trading as TMGM, is authorized and regulated by the Financial Services Authority (FSA) of Seychelles, with license number SD224. The company is registered at Office No 13, Providence Estate ABIS Centre, Mahe, Seychelles.
Email: support@tmgm.com
Trademax Global Markets (International) Pty Ltd, trading as TMGM, is authorized and regulated by the Financial Services Commission, Mauritius (FSC) with license no. GB22201012, and registered at 33, Edith Cavell Street C/o IQ EQ Fund Services (Mauritius) Ltd Port Louis, 11324 Mauritius.
Email: support@tmgm.com
Copyright © TMGM. All rights reserved