

Trading
Explore a wide range of markets with competitive pricing, deep liquidity, and advanced trading tools.
Learn More 
Platform
Trade seamlessly with TMGM's powerful platform, built for speed, precision, and a superior trading experience.
Learn More Trading Platform
Academy
Learn the fundamentals of trading with beginner-friendly resources, including guides, webinars, and market insights.
Learn More News & Analysis
Get real-time market updates and expert analysis to stay ahead of trading opportunities
Learn More News & Analysis
About
Learn what sets TMGM apart — our global presence, regulatory strength, and commitment to innovation in trading.
Learn More Why Choose TMGM
Sponsorship
How are earnings and cheaper Crude Oil lifting the Dow Jones Industrial Average?
- DJIA closes near 52,500 after reaching its highest level in over five weeks.
- UnitedHealth, Amazon, IBM and 3M lead point gains amid declining Treasury yields.
- Wednesday brings IBM's results, followed by Honeywell and Procter & Gamble on Thursday.
The Dow Jones Industrial Average reached its highest level in more than five weeks, supported by earnings and lower Crude Oil prices, even as artificial intelligence (AI) shares dragged down the NASDAQ 100. Gains from the opening bell took the Dow just above 52,700. A reversal to about 52,400 followed within a single five-minute bar after a diplomat involved in US-Iran talks dismissed reports that a deal was close. The index finished just below 52,500.

Health care topped the sector performance table in the S&P 500, while the largest point contributions to the price-weighted Dow came from UnitedHealth (UNH), Amazon (AMZN), IBM (IBM) and 3M (MMM). Alongside lifting its 2026 profit guidance to $9.10-$9.15 a share, 3M granted Amazon a warrant for up to 3.2 million shares linked to $6 billion in data centre sales. Having reported on 13 October, UnitedHealth contributed about three times the points added by 3M.
Lower Crude Oil prices were accompanied by a decline in the 10-year Treasury yield. The moves came a week after rising yields and concerns about AI debt had left US equities with their worst week since June. Elice, a Korean AI firm, lost more than 30% on its Seoul debut. Yet Nvidia (NVDA) and Microsoft (MSFT) both advanced, limiting the drag on the Dow from the AI sell-off.
What is next on the calendar?
Wednesday's IBM results will be followed by a call at 21:00 GMT. Honeywell (HON) and Procter & Gamble (PG) are scheduled to release results before Thursday's opening bell, with calls at 12:30 GMT. On Friday, American Express (AXP) reports before the opening bell, making it the fourth Dow constituent to announce results over three days.
Thursday's initial jobless claims release at 12:30 GMT is expected to show 200K, compared with the previous 199K. Friday brings the flash Purchasing Managers Index (PMI) surveys from S&P Global at 13:45 GMT; the services reading is forecast at 57.9, down from 58.8. Both releases will inform the Fed's 28 October decision on whether to increase rates again.
What do the charts indicate?
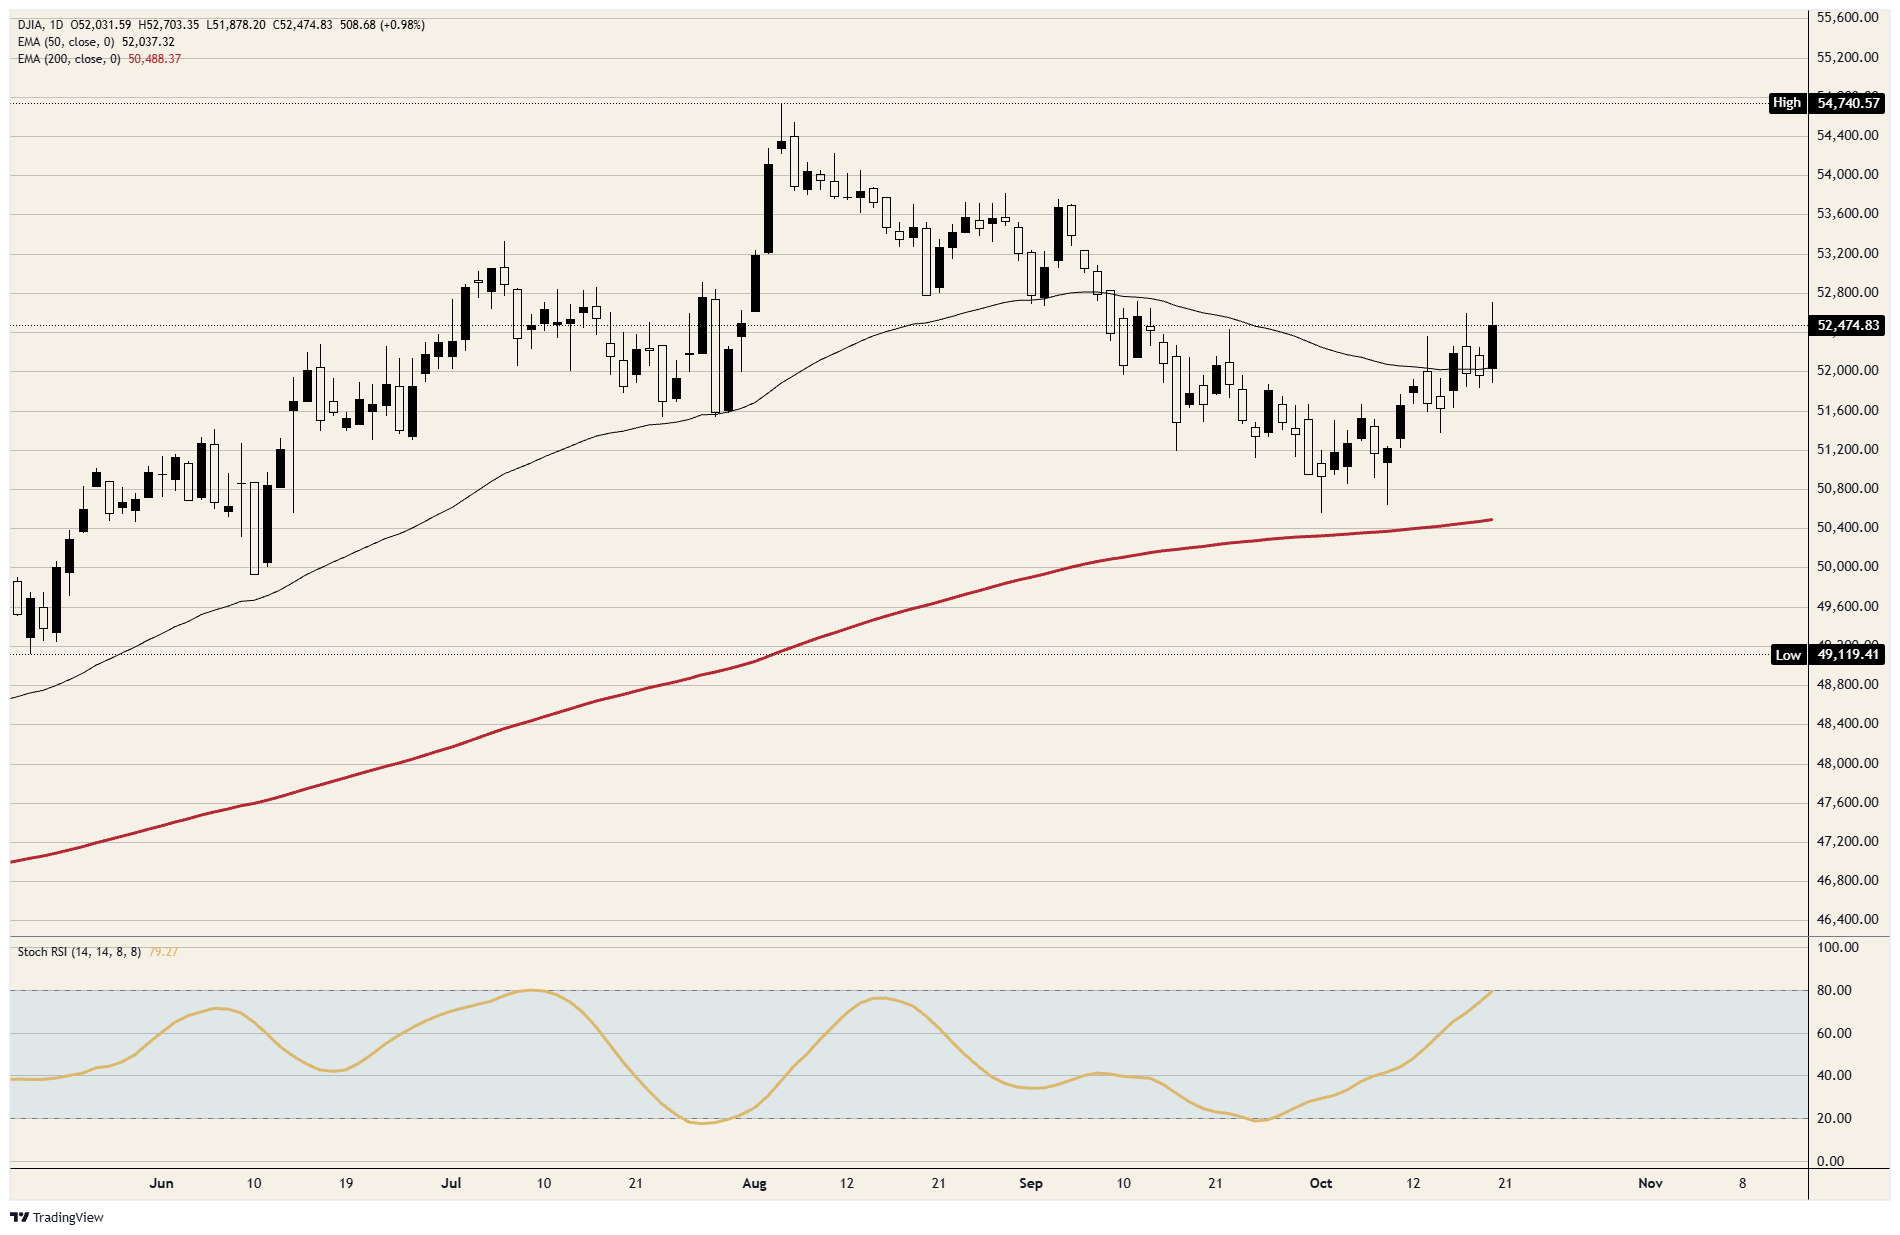
After slipping below its 50-day Exponential Moving Average (EMA) on Friday and Monday, the Dow closed back above that line, which now stands near 52,000. Nearly half the decline from August's peak just above 54,700 to the 1 October low has now been recovered. That low held just above the 200-day EMA near 50,500. For the first time since early July, daily momentum is bordering on overbought territory.
Daily chart of the DJIA
Dow Jones: frequently asked questions
Among the world's oldest stock market indices, the Dow Jones Industrial Average comprises the 30 most traded US stocks. Instead of market capitalisation, share prices determine each constituent's weight. Its value is calculated by adding the constituent share prices and dividing the total by a factor, currently 0.152. Charles Dow, who also established the Wall Street Journal, founded the index. Criticism in later years has centred on its limited representation of the market: it follows only 30 conglomerates, in contrast to broader indices such as the S&P 500.
The Dow Jones Industrial Average (DJIA) responds to a range of influences, foremost among them the combined performance of its constituent companies as shown in quarterly earnings reports. Macroeconomic releases from the US and elsewhere also play a role by shaping investor sentiment. Another influence is the interest rate set by the Federal Reserve (Fed), which determines borrowing costs for the many companies that depend heavily on credit. Inflation can therefore be an important driver, alongside other indicators that affect the Fed's decisions.
Developed by Charles Dow, Dow Theory seeks to identify the stock market's primary trend. It calls for a comparison between the direction of the Dow Jones Industrial Average (DJIA) and that of the Dow Jones Transportation Average (DJTA), with trends followed only when both indices move in the same direction. Trading volume serves as confirmation, while analysis of peaks and troughs also forms part of the method. The theory sets out three trend phases: accumulation, as smart money begins buying or selling; public participation, as the wider public enters; and distribution, as smart money leaves.
Investors and traders can access the DJIA through several instruments. ETFs offer a way to trade it as one security without purchasing shares in each of its 30 constituent companies; the SPDR Dow Jones Industrial Average ETF (DIA) is a leading example. Futures contracts allow speculation on the DJIA's future value. Options, meanwhile, confer the right, without any obligation, to buy or sell the index at a price agreed in advance for a future date. Through mutual funds, investors can purchase a share in a diversified portfolio of DJIA stocks, gaining exposure to the index as a whole.
POPULAR ARTICLES
1Can Bitcoin hold $82,500 support as Nasdaq correlation returns amid macro pressures?2Chinese Yuan: Does the policy-rate tweak leave the appreciation outlook unchanged? – Commerzbank3Indonesian Rupiah: Hedging Against Downside Risk Amid Equity Reforms – MUFG4Are global rate hike risks keeping gold on the back foot near $4,150?5How are earnings and cheaper Crude Oil lifting the Dow Jones Industrial Average?6Malaysian Ringgit: Trading range against US Dollar remains stable amid hawkish BNM bias – Commerzbank7Bank of Canada: Is the growth-inflation trade-off taking centre stage? – RBC8BoE's Greene expresses concern that "stance is not restrictive enough"9China: CNY backdrop supported by growth momentum – MUFG
LIVE QUOTES


ALL ABOUT INDICATORS
Moving Average Crossover: How to Read and Trade the Signal
Zero Lag Exponential Moving Average (ZLEMA): Formula, Calculation and How to Use It
What Is a Triple Exponential Moving Average: How It Works & How to Trade It
Death Cross: Understand the Signal and Its Track Record
Double Exponential Moving Average: How It Works & How to Use It
What Is a Golden Cross? Formation and Trading Guide
EMA vs SMA: What's the Difference and Which Is Better?
Exponential Moving Average (EMA): Formula, Settings & Strategies
5 Best Support and Resistance Indicators
Get Started!
Sign up and access the Global Markets in less than 3 minutes

Connect With Us









Contacts
Phone: +61 2 8036 8388
Fax: +61 2 8036 8388
Email: support@tmgm.com



The information provided on this website is of a general nature only and does not constitute personal financial advice. Before acting on any information on this website, you should consider the suitability of the information in relation to your objectives, financial situation and needs. Investing in CFDs and FX Margin Contracts carries significant risks and is not suitable for all investors. You may lose more than your initial deposit. You do not own, or have, any interest in the underlying asset. We recommend that you seek independent advice and ensure you fully understand the risks involved before trading. It is important that you read and consider the disclosure document before you acquire any product listed on the website. The information and advertisements offered on this website are not intended for use by any person in any country or jurisdiction where such use would be contrary to local laws and regulations. The Products and Services offered on this website are not intended for residents of the United States, Malaysia and Thailand.
TMGM is authorized and regulated in various jurisdictions.
Trademax Australia Limited, trading as TMGM, is regulated by the Australian Securities and Investments Commission (ASIC), AFSL no. 436416 and is located at Level 28, One International Tower, 100 Barangaroo Avenue, 2000 Sydney, NSW Australia.
Email: support@tmgm.com.au
Trademax Global Limited, trading as TMGM, is authorized and regulated by the Vanuatu Financial Services Commission (VFSC), registration number 40356 and registered at 1276, Kumul Highway, Port Vila, Vanuatu, Republic of Vanuatu.
Email: support@tmgm.com
Trademax Global Markets (SE) Limited, trading as TMGM, is authorized and regulated by the Financial Services Authority (FSA) of Seychelles, with license number SD224. The company is registered at Office No 13, Providence Estate ABIS Centre, Mahe, Seychelles.
Email: support@tmgm.com
Trademax Global Markets (International) Pty Ltd, trading as TMGM, is authorized and regulated by the Financial Services Commission, Mauritius (FSC) with license no. GB22201012, and registered at 33, Edith Cavell Street C/o IQ EQ Fund Services (Mauritius) Ltd Port Louis, 11324 Mauritius.
Email: support@tmgm.com
Copyright © TMGM. All rights reserved