

Trading
Explore a wide range of markets with competitive pricing, deep liquidity, and advanced trading tools.
Learn More 
Platform
Trade seamlessly with TMGM's powerful platform, built for speed, precision, and a superior trading experience.
Learn More Trading Platform
Academy
Learn the fundamentals of trading with beginner-friendly resources, including guides, webinars, and market insights.
Learn More News & Analysis
Get real-time market updates and expert analysis to stay ahead of trading opportunities
Learn More News & Analysis
About
Learn what sets TMGM apart — our global presence, regulatory strength, and commitment to innovation in trading.
Learn More Why Choose TMGM
Sponsorship
NSA outage sends Dow Jones Industrial Average lower before Nvidia beats
- Selling pressure takes DJIA down more than 1,000 points at its low before Tuesday's close near 50,750.
- Chip stocks face selling ahead of Nvidia results as Home Depot and Salesforce decline.
- Shares advance after Nvidia reports estimate-beating revenue of $115.8 billion.
Heavy selling pushed the Dow Jones Industrial Average (DJIA) sharply lower for a second consecutive day as a report of a National Security Agency (NSA) network outage weighed on the market. After losing more than 1,000 points to trade just below 50,600, the index finished Tuesday near 50,750. Elsewhere, the S&P 500 recorded its weakest close since late July, while the Nasdaq Composite hit its lowest level since April.

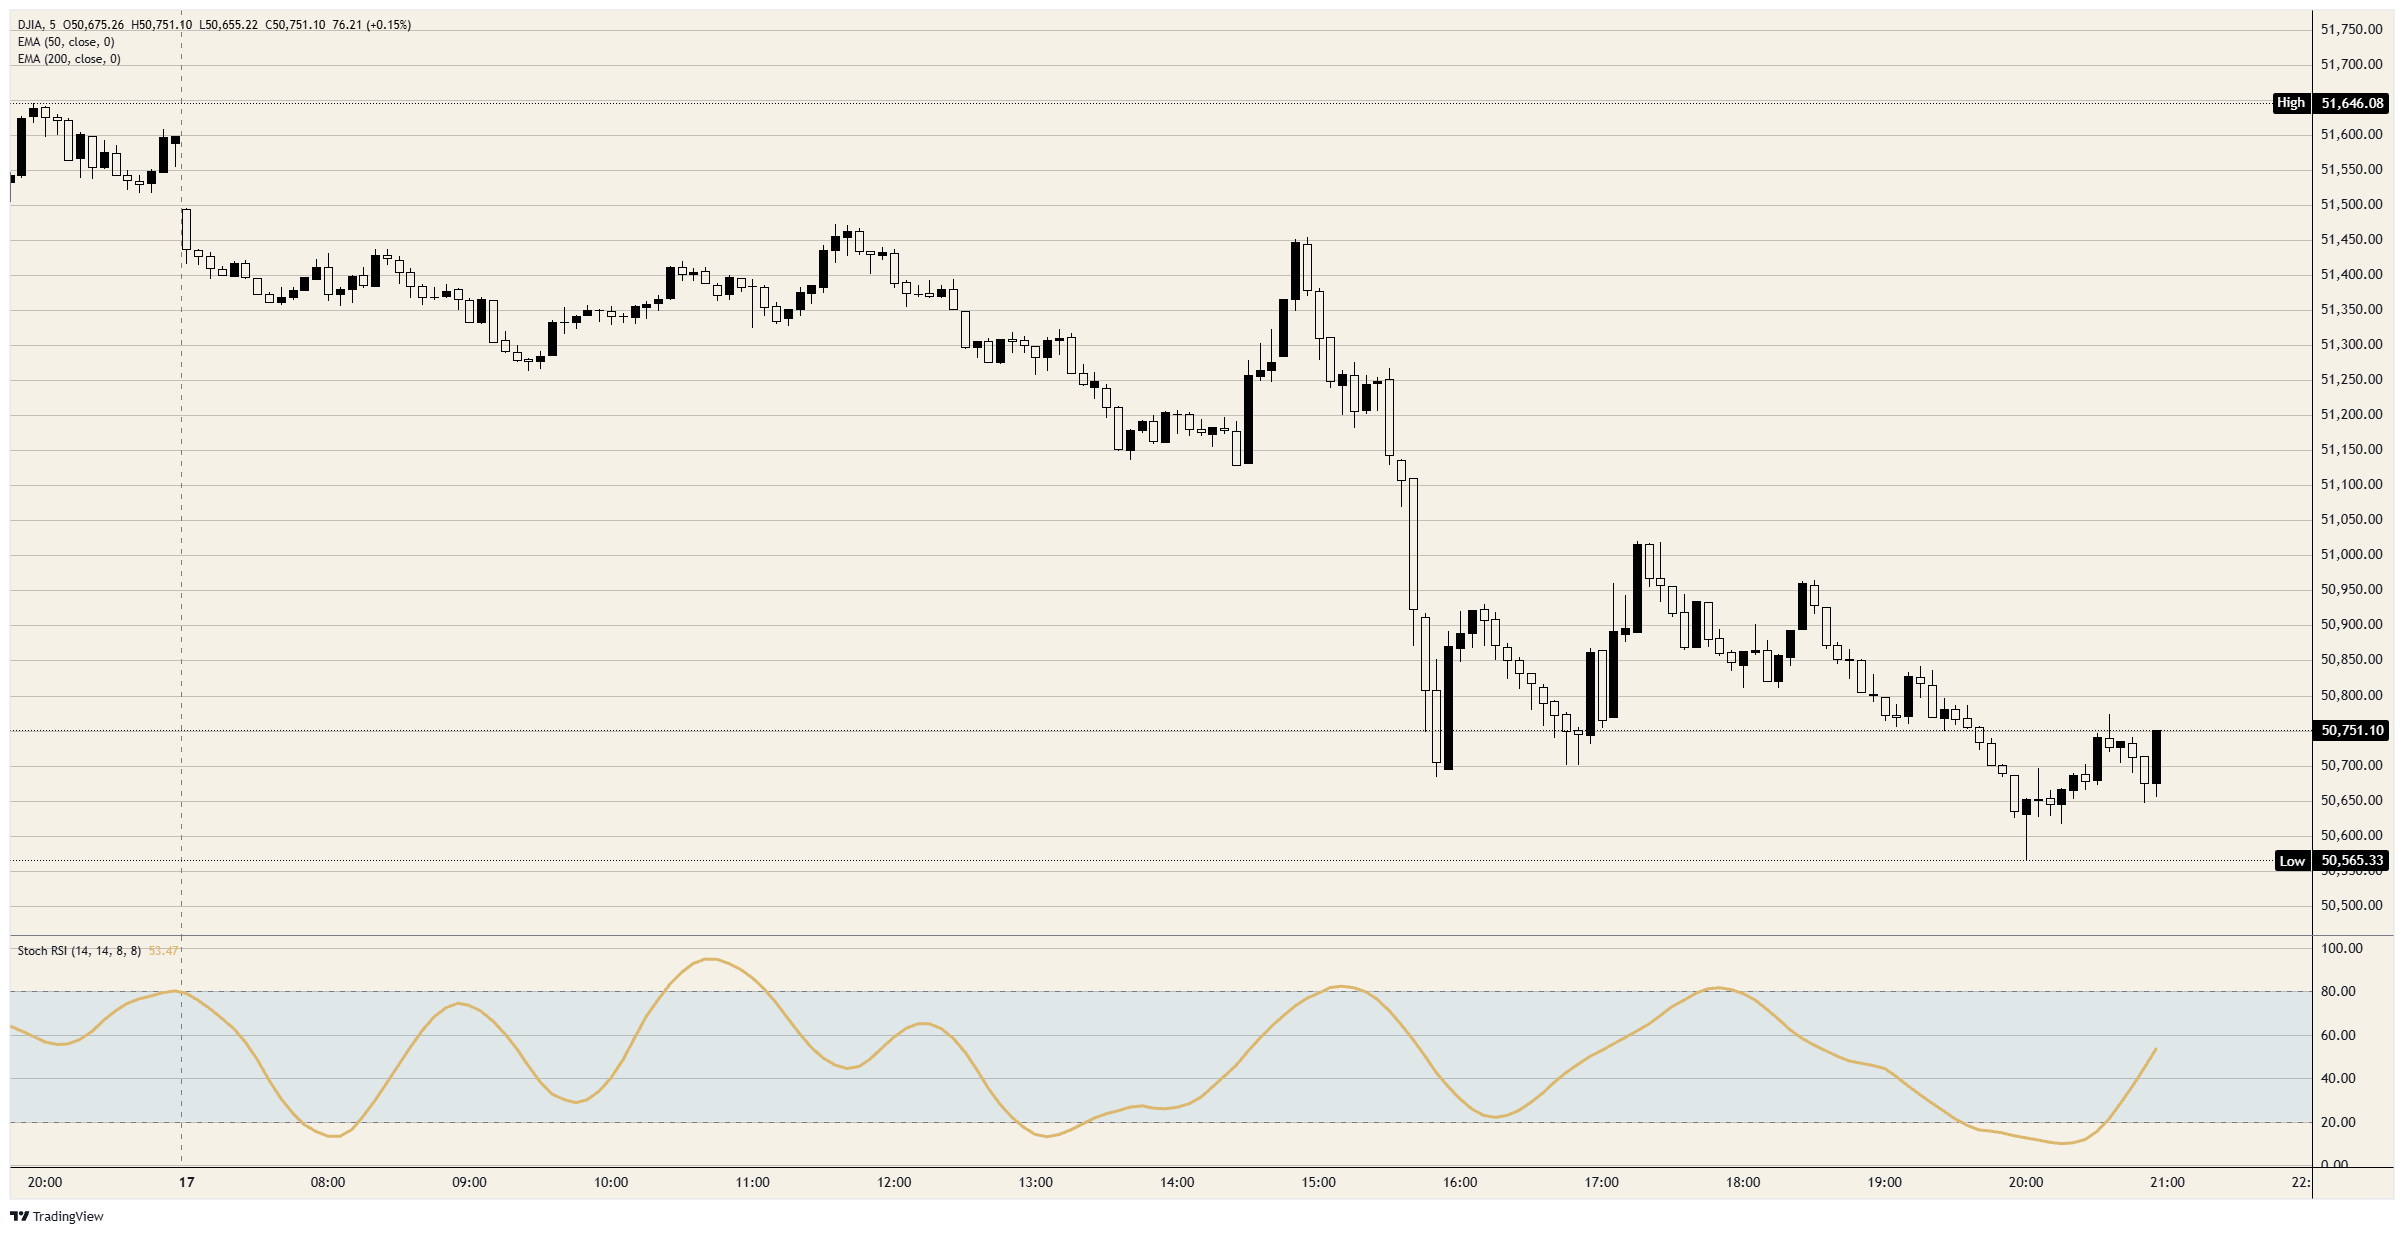
Losses in Home Depot (HD), which slipped about 2.5% after appointing a new chief executive, and Salesforce (CRM), which dropped more than 8%, had already weighed on the index. A subsequent CNN report said a classified NSA network was down, with no indication of a cyberattack. Over five five-minute bars, the index then slid from about 51,250 to near 50,700. Although the NSA later attributed the network degradation to scheduled maintenance, the index subsequently extended its decline to the session low.
Selling also hit chip stocks before results from index constituent Nvidia (NVDA), its first earnings release since Jensen Huang stepped down as chief executive. His resignation followed reports of affairs with a company executive and a woman whom US officials allege is a Chinese spy. Both revenue of $115.8 billion and the current-quarter forecast of $130.0 billion exceeded estimates. Following the release, Nvidia shares climbed above $160, with Nasdaq futures also moving higher.
Which Upcoming Data Could Influence the Fed?
Housing starts are due on Wednesday at 13:30 GMT, with a forecast of 1.27 million compared with the previous 1.221 million. The Fed's October minutes follow at 19:00 GMT. Thursday brings initial jobless claims at 13:30 GMT, with expectations of 196K against 200K. Each of these three releases has implications for the Fed's December 8-9 decision, for which markets have already priced in a rate hike.
What Does the Chart Show About the Sell-Off?
Following the NSA statement, the index set a second low below its first trough, even as the S&P 500 and Nasdaq remained above the lows reached after CNN's report. A recovery between the two troughs took the index just above 51,000, retracing a little more than half of the report-driven fall. The final five-minute bar closed above the first low. However, none of the session's bars reached Monday's late high just below 51,700.
Dow Jones chart: 5-minute intervals
Dow Jones: Common Questions
Comprising the 30 most traded US stocks, the Dow Jones Industrial Average ranks among the world's oldest stock market indices. Its constituents are weighted by share price, not market capitalisation. To calculate the index, their prices are added together and divided by a factor that currently stands at 0.152. Charles Dow, who also established the Wall Street Journal, founded the index. In subsequent years, critics have questioned how representative it is: unlike broader benchmarks such as the S&P 500, it follows only 30 conglomerates.
The combined performance of its constituent companies, as disclosed in quarterly earnings reports, is the principal driver of the Dow Jones Industrial Average (DJIA). Other influences include US and global macroeconomic releases, which shape investor sentiment. Interest rates determined by the Federal Reserve (Fed) also affect the index by changing borrowing costs for corporations, many of which depend heavily on credit. Inflation can therefore be an important influence, alongside other indicators that inform the Fed's decisions.
Developed by Charles Dow, Dow Theory offers a way to identify the stock market's primary trend. Central to the approach is a comparison of the Dow Jones Industrial Average (DJIA) with the Dow Jones Transportation Average (DJTA): a trend is followed only when both move in the same direction, with trading volume providing confirmation. The theory also draws on peak-and-trough analysis. Dow identified three phases within a trend: accumulation, as smart money begins buying or selling; public participation, as the wider public enters; and distribution, as smart money exits.
Investors have several routes to trading the DJIA. ETFs offer exposure through a single security, removing the need to purchase shares in each of the 30 constituent companies; the SPDR Dow Jones Industrial Average ETF (DIA) is a leading example. Futures contracts on the DJIA allow traders to speculate on its future value. Options, meanwhile, give the right, without imposing an obligation, to buy or sell the index at a predetermined future price. Through mutual funds, investors can purchase a share in a diversified portfolio of DJIA stocks and thereby gain exposure to the overall index.
POPULAR ARTICLES
1NSA outage sends Dow Jones Industrial Average lower before Nvidia beats2Natural gas: Why does falling US demand offer Europe only limited relief? - Commerzbank3Chinese Yuan: Is further strength against the US Dollar likely? – UOB4Copper: Commerzbank sees a gradual climb into 20285Ethereum Price Forecast: Why has ETH slipped below $1,800 ahead of Nvidia's earnings?6Taiwan Dollar: How are equity outflows weighing on TWD? – OCBC7Crude Oil rises on Gulf attacks, yet most of Monday's losses remain8Gold holds above Monday's low as it recoups retail sales-driven losses9Oil: How is recovering supply weighing on prices? – ING


Get Started!
Sign up and access the Global Markets in less than 3 minutes

Connect With Us









Contacts
Phone: +61 2 8036 8388
Fax: +61 2 8036 8388
Email: support@tmgm.com



The information provided on this website is of a general nature only and does not constitute personal financial advice. Before acting on any information on this website, you should consider the suitability of the information in relation to your objectives, financial situation and needs. Investing in CFDs and FX Margin Contracts carries significant risks and is not suitable for all investors. You may lose more than your initial deposit. You do not own, or have, any interest in the underlying asset. We recommend that you seek independent advice and ensure you fully understand the risks involved before trading. It is important that you read and consider the disclosure document before you acquire any product listed on the website. The information and advertisements offered on this website are not intended for use by any person in any country or jurisdiction where such use would be contrary to local laws and regulations. The Products and Services offered on this website are not intended for residents of the United States, Malaysia and Thailand.
TMGM is authorized and regulated in various jurisdictions.
Trademax Australia Limited, trading as TMGM, is regulated by the Australian Securities and Investments Commission (ASIC), AFSL no. 436416 and is located at Level 28, One International Tower, 100 Barangaroo Avenue, 2000 Sydney, NSW Australia.
Email: support@tmgm.com.au
Trademax Global Limited, trading as TMGM, is authorized and regulated by the Vanuatu Financial Services Commission (VFSC), registration number 40356 and registered at 1276, Kumul Highway, Port Vila, Vanuatu, Republic of Vanuatu.
Email: support@tmgm.com
Trademax Global Markets (SE) Limited, trading as TMGM, is authorized and regulated by the Financial Services Authority (FSA) of Seychelles, with license number SD224. The company is registered at Office No 13, Providence Estate ABIS Centre, Mahe, Seychelles.
Email: support@tmgm.com
Trademax Global Markets (International) Pty Ltd, trading as TMGM, is authorized and regulated by the Financial Services Commission, Mauritius (FSC) with license no. GB22201012, and registered at 33, Edith Cavell Street C/o IQ EQ Fund Services (Mauritius) Ltd Port Louis, 11324 Mauritius.
Email: support@tmgm.com
Copyright © TMGM. All rights reserved