

Trading
Explore a wide range of markets with competitive pricing, deep liquidity, and advanced trading tools.
Learn More 
Platform
Trade seamlessly with TMGM's powerful platform, built for speed, precision, and a superior trading experience.
Learn More Trading Platform
Academy
Learn the fundamentals of trading with beginner-friendly resources, including guides, webinars, and market insights.
Learn More News & Analysis
Get real-time market updates and expert analysis to stay ahead of trading opportunities
Learn More News & Analysis
About
Learn what sets TMGM apart — our global presence, regulatory strength, and commitment to innovation in trading.
Learn More Why Choose TMGM
Sponsorship
Are Ethereum ETFs heading for a fourth week of outflows as Coinbase Premium hits its lowest since June?
Ethereum price today: Can ETH find support at $2,370?
- Net withdrawals from US spot Ethereum ETFs look set to extend into a fourth straight week.
- The Coinbase Premium Index has weakened to a level last seen in June.
- Support at $2,355 and the 100-day EMA are being tested by ETH.
Risk aversion continued to grip US markets on Friday, pushing Ethereum (ETH) below $2,400.
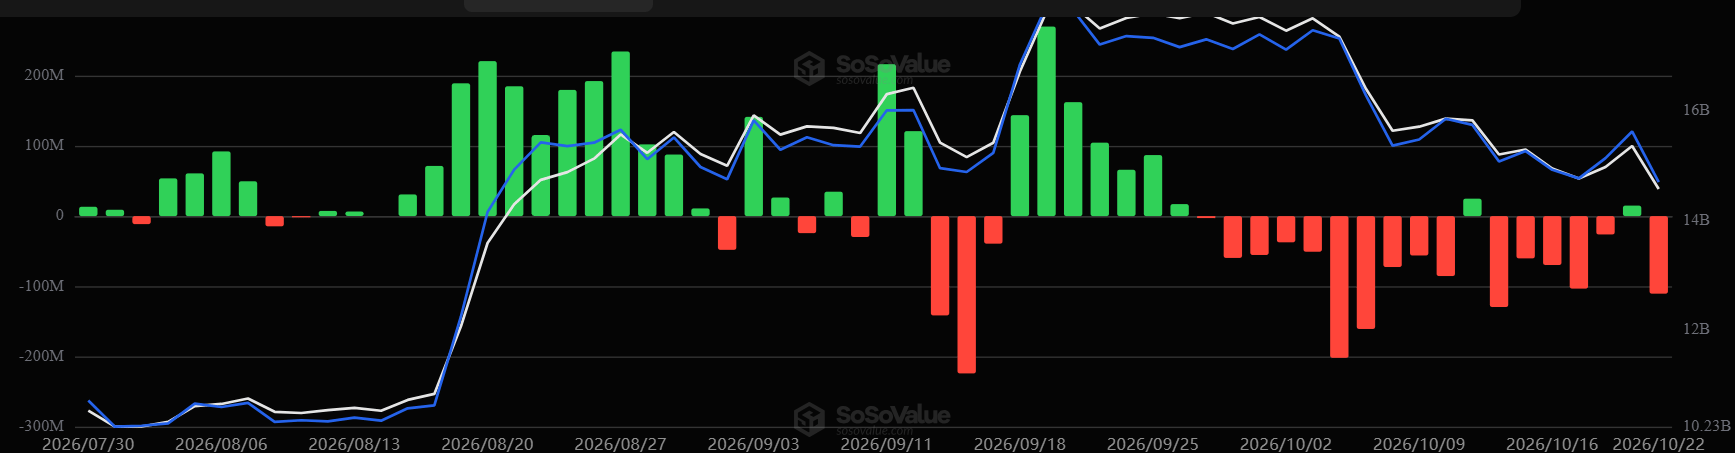
A fourth straight week of net outflows is taking shape for US spot ETH exchange-traded funds (ETFs), with a further $110.5 million withdrawn on Thursday. Over the last 18 trading days, these products have attracted inflows on just two occasions, with the combined amount below $40 million.

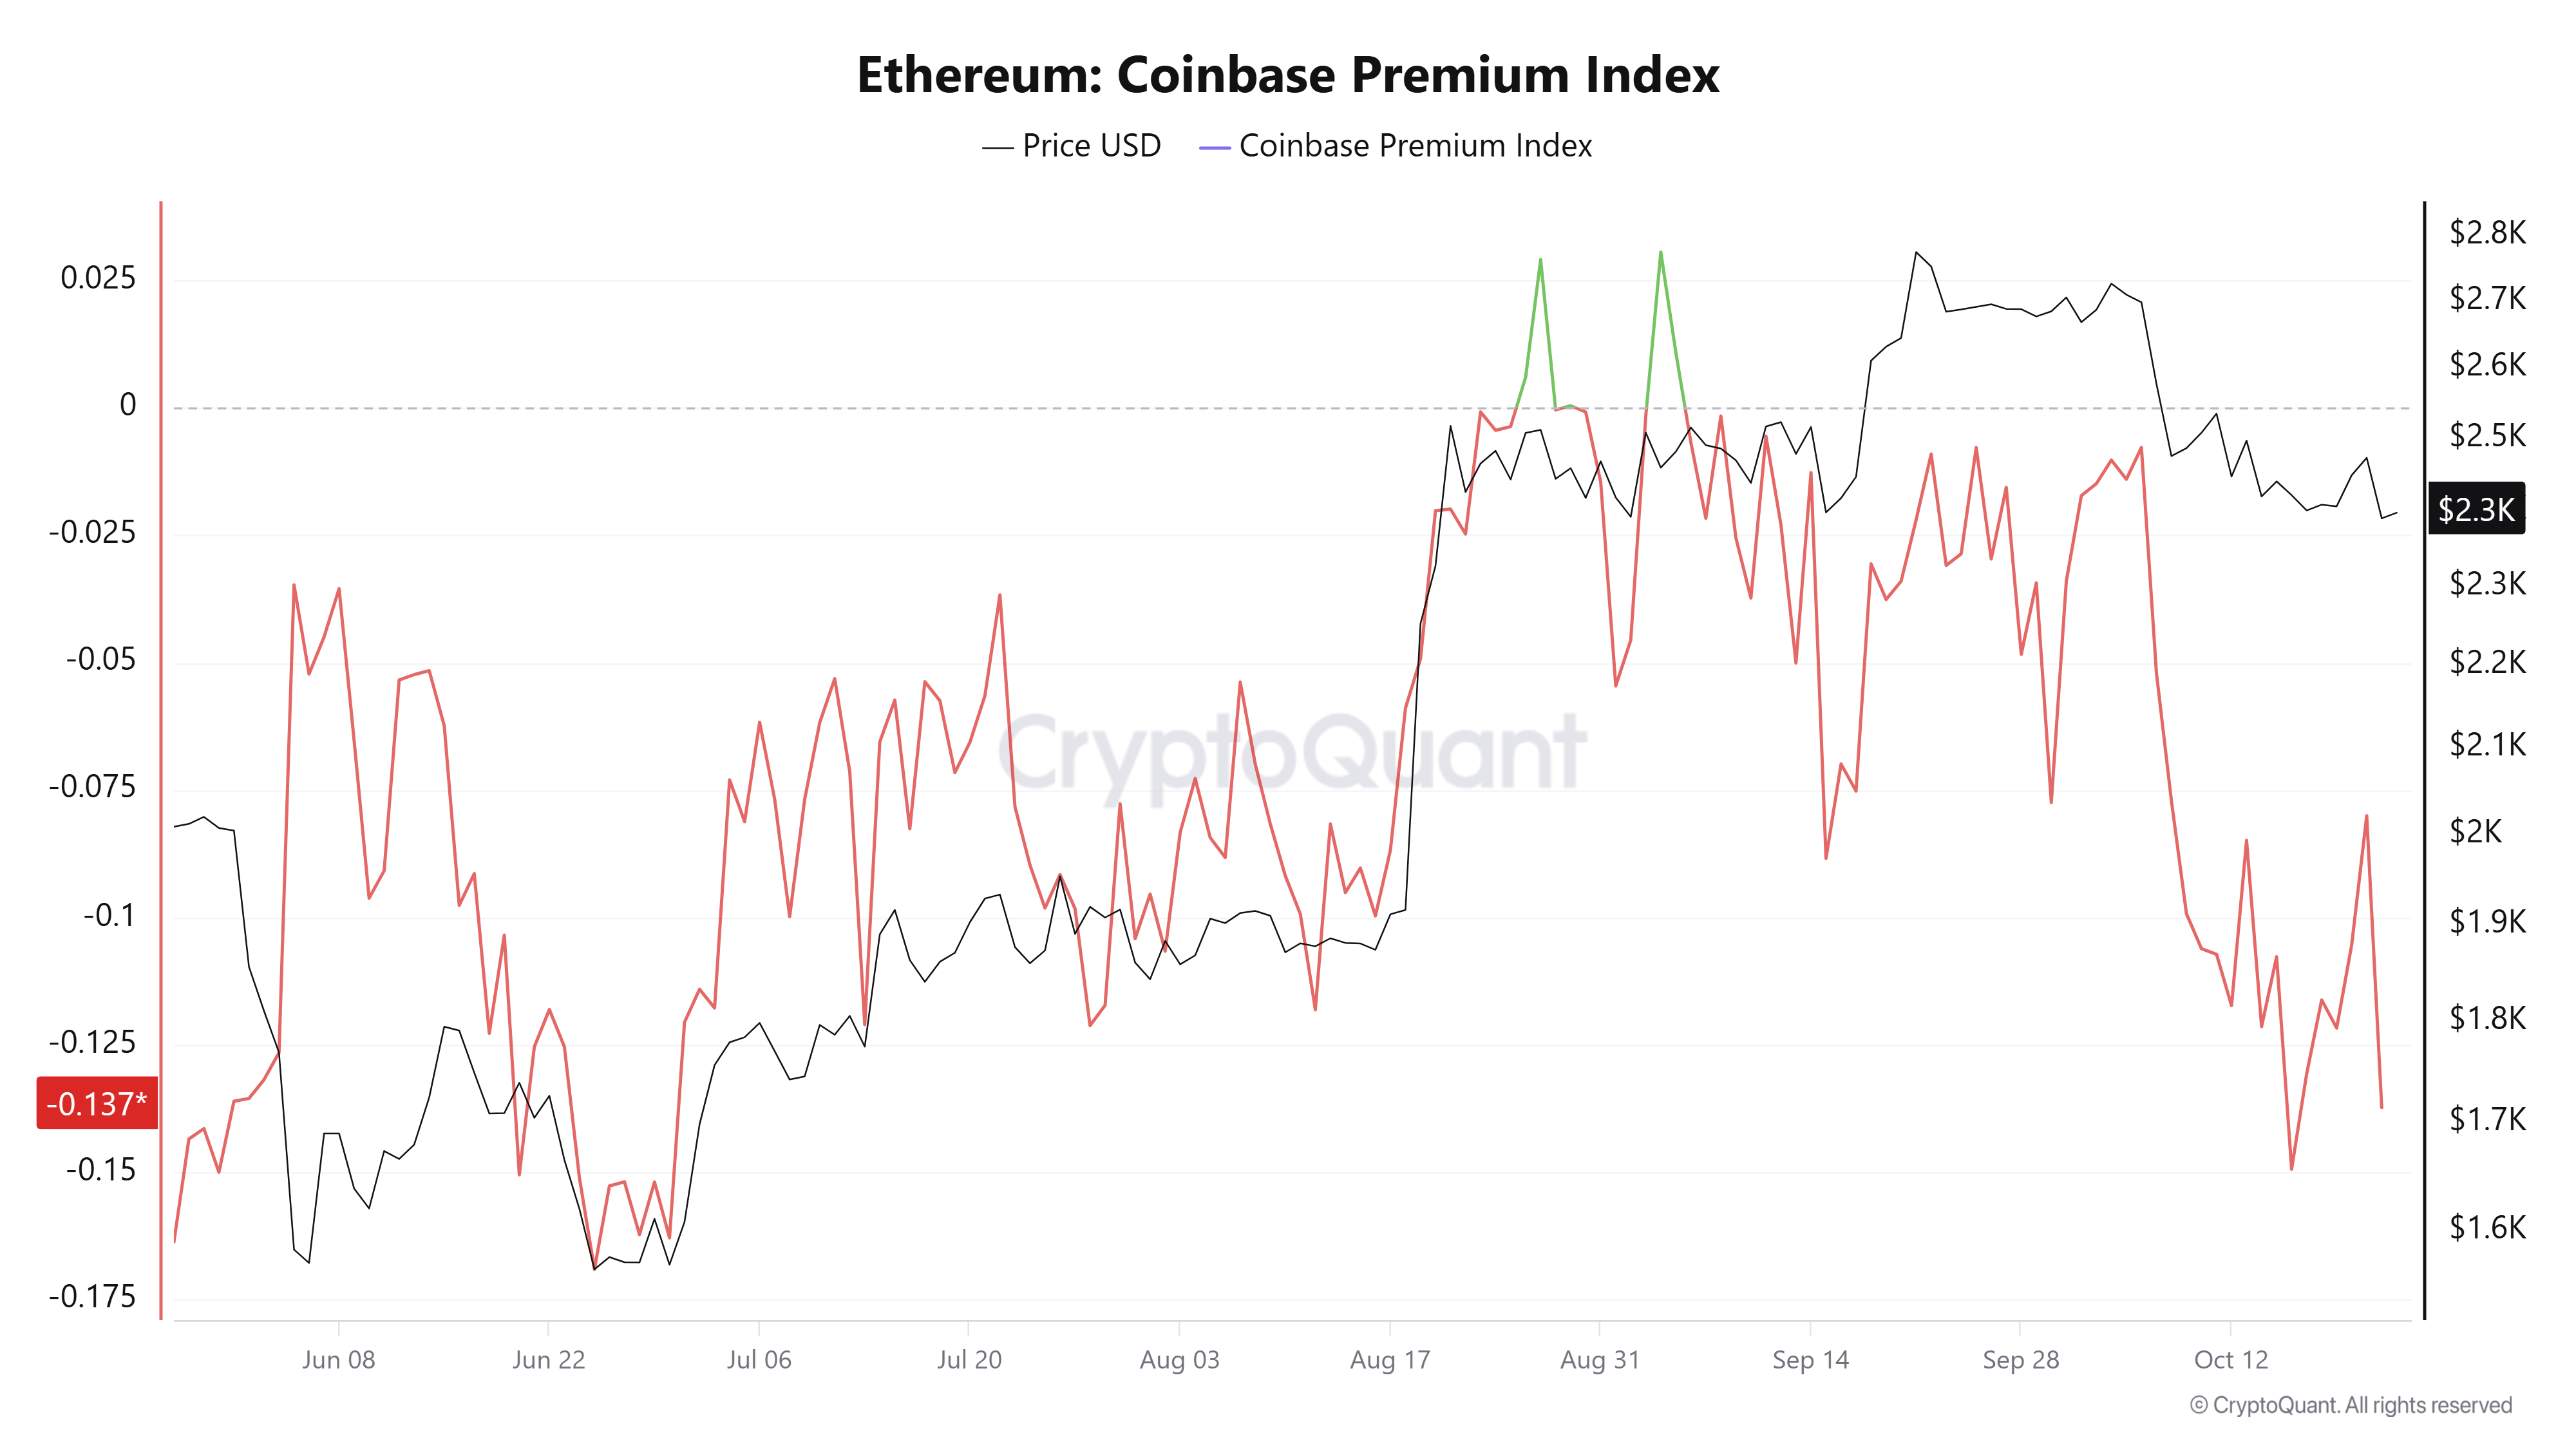
US crypto-native trading platforms are showing a comparable trend. After briefly recovering earlier in the week, the Coinbase Premium Index has resumed its decline. The index tracks the price gap between an asset traded on Coinbase Pro and Binance.
At -0.137, the index has reached its weakest reading since June, when ETH formed a cycle low near $1,500. According to on-chain analytics firm CryptoQuant, persistently negative readings show that ETH trades at a lower price on Coinbase than on Binance, signalling comparatively softer demand or active selling in US-based markets.
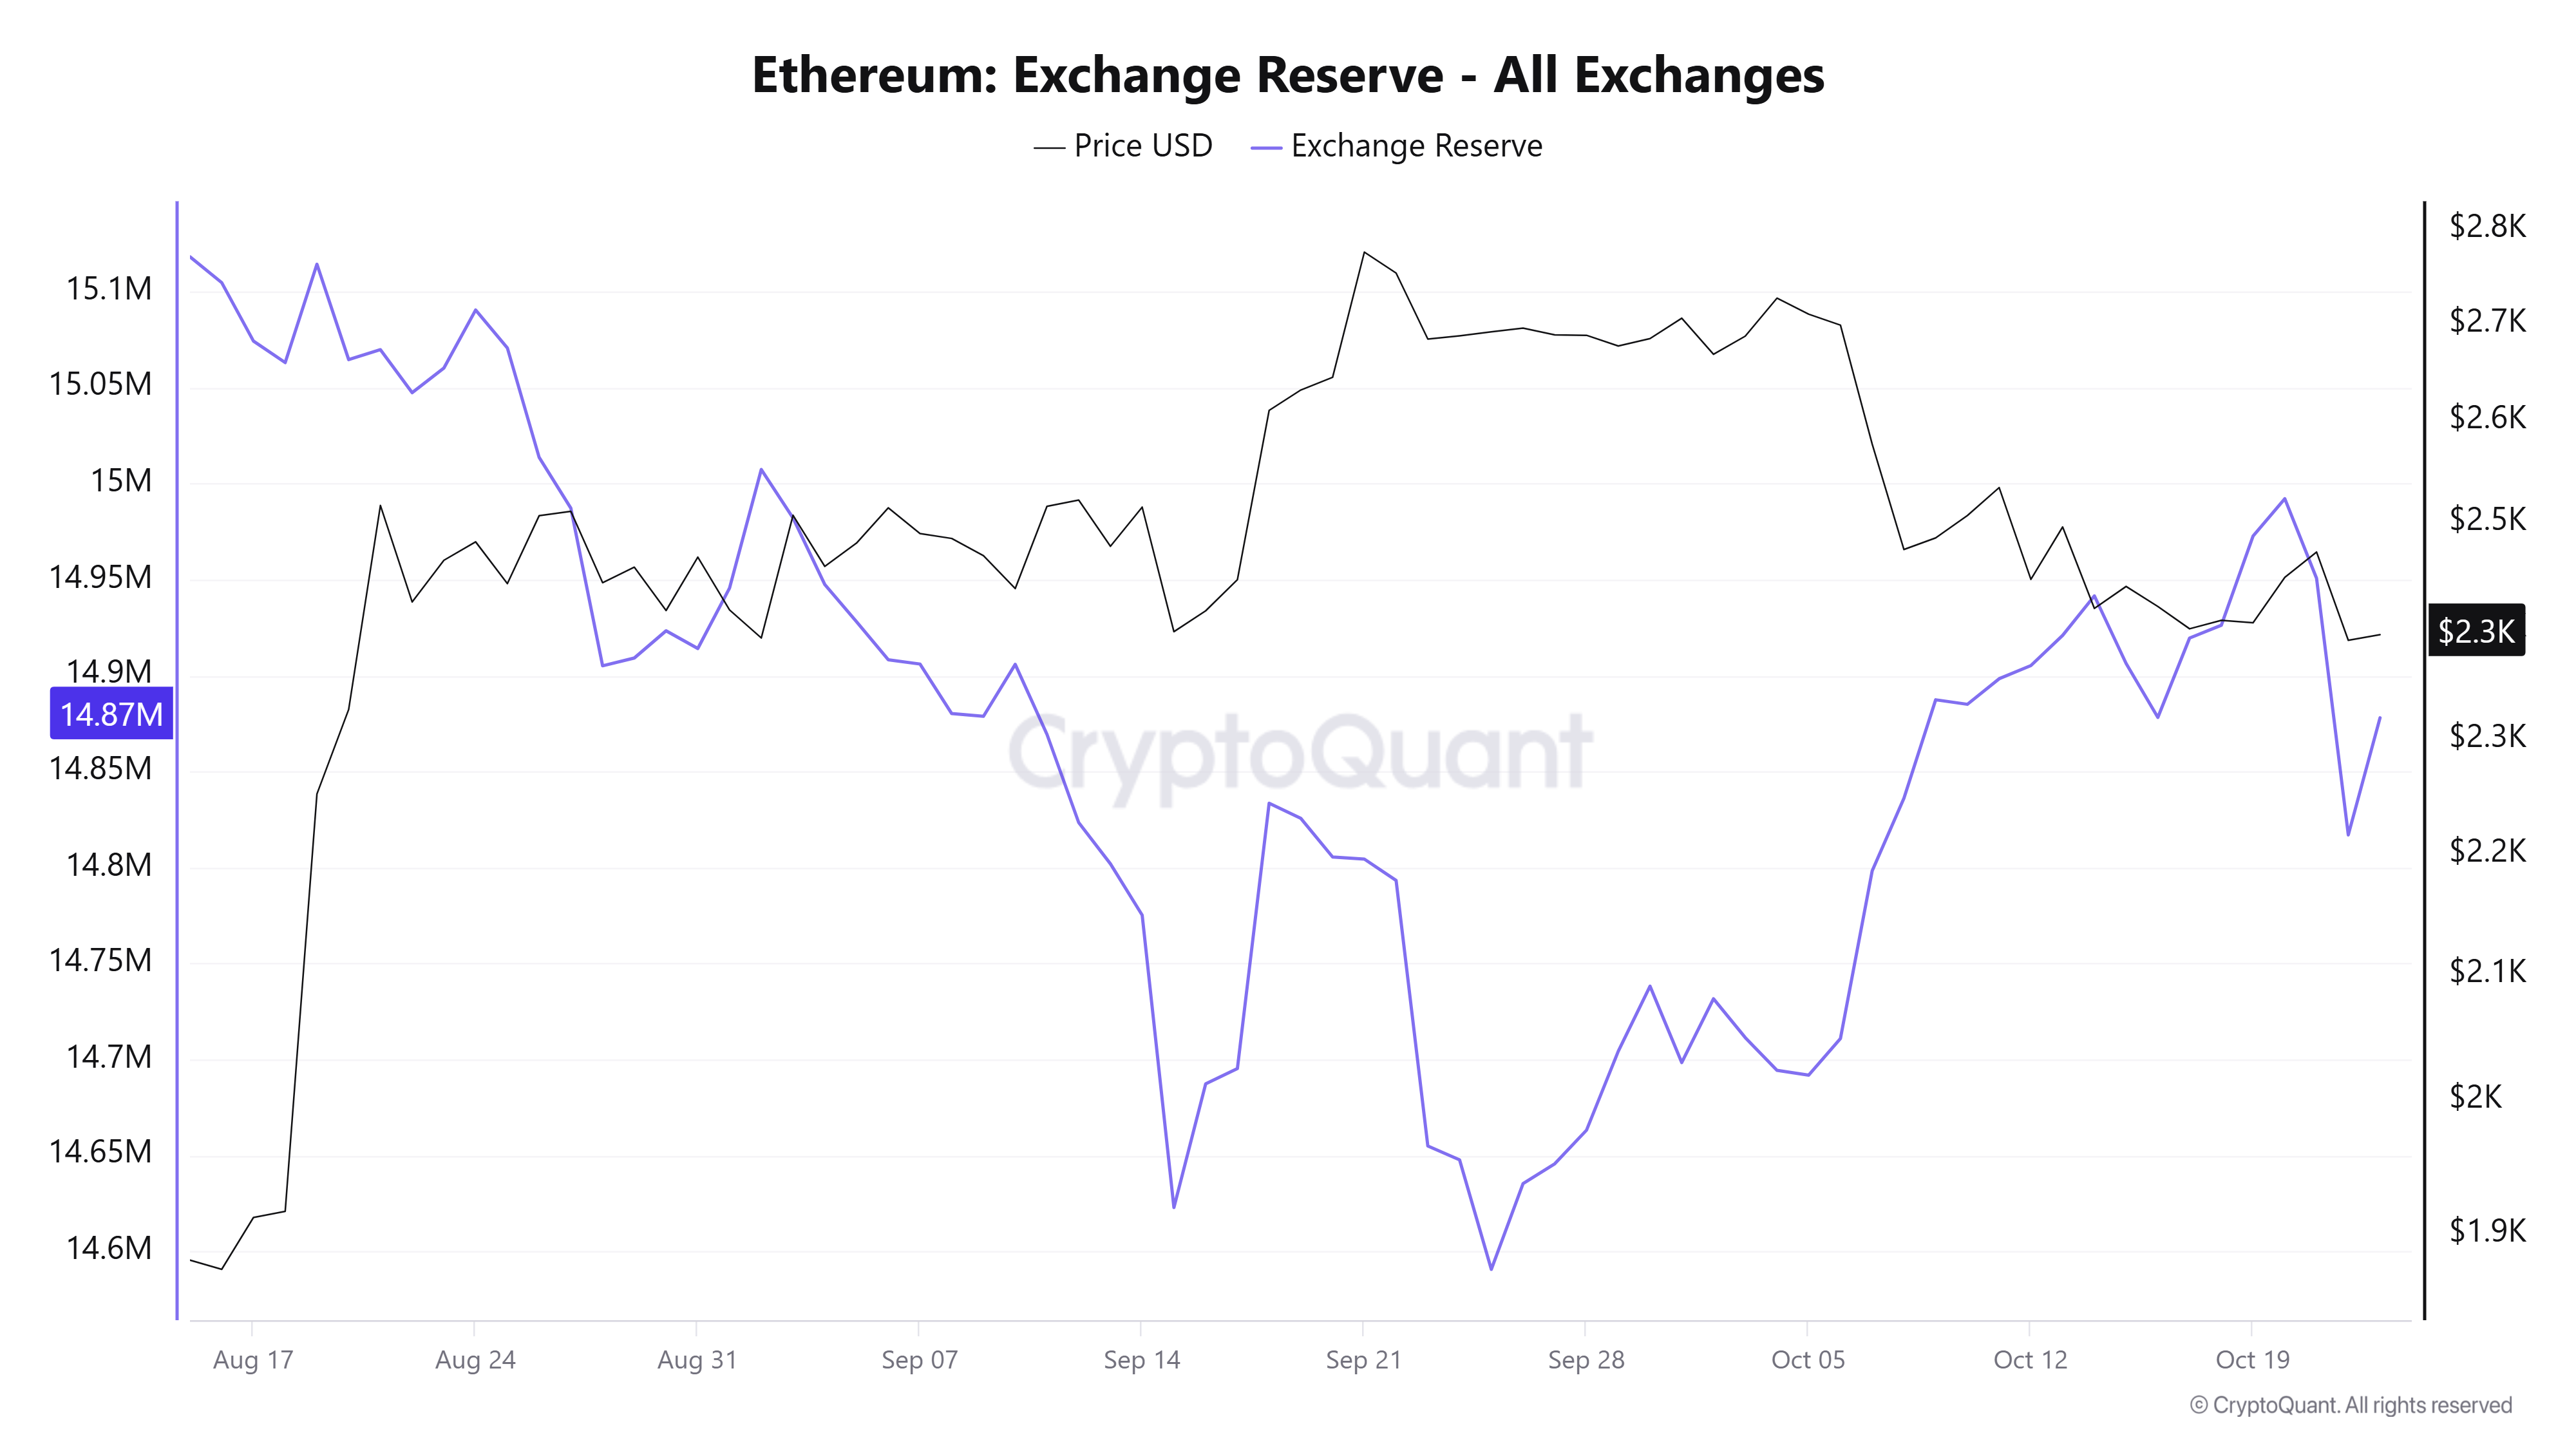
Selling in the influential US market may be putting pressure on ETH spot markets more broadly. Following a modest dip on October 22, Ethereum Exchange Reserves edged higher again on Friday. This metric tracks the total ETH held in wallets across exchanges.
Between September 25 and October 20, Exchange Reserves rose by 402K ETH. Although reserves fell by 170K ETH over the past two days, they are now moving higher again.
With selling pressure prevailing, the Realized Price at $2,311 remains an important support to monitor. This represents the average on-chain cost basis.
Ethereum technical outlook: Can the 100-day EMA support ETH?
Coinglass data show that Ethereum liquidations totalled $60.5 million over the past 24 hours, with long positions accounting for the largest share at $50.1 million.
A bearish corrective bias persists on ETH's daily chart, with the price trading below the 20-day and 50-day Exponential Moving Averages (EMAs), which converge near $2,470. Nevertheless, the altcoin remains just above the 100-day EMA around $2,357 and horizontal support nearby at $2,355. This suggests that sellers are challenging the broader medium-term base without having breached it so far. Downward pressure remains evident in the 14-day Relative Strength Index (RSI), near 38, and a Stochastic reading approaching oversold territory. These indicators also point to scope for short-covering should support hold.
Any recovery would first encounter resistance at the 20-day and 50-day EMAs. Beyond them lie the previous horizontal ceiling at $2,548 and another hurdle near $2,637. Further up, resistance strengthens at $2,782, followed by $3,075 and $3,253.
The first downside support zone comprises the 100-day EMA at $2,357 and the neighbouring horizontal level of $2,355. Should ETH close below this area on a daily basis, the next support levels would come into focus at $2,205, followed by $1,972 and $1,828. Buyers would be expected to regroup more firmly at these levels.
(An AI tool assisted in preparing the technical analysis for this article. Learn more.)
POPULAR ARTICLES
1Are Ethereum ETFs heading for a fourth week of outflows as Coinbase Premium hits its lowest since June?2HYPE Trades 21% Below Peak as Hyperliquid Strategies Raises Buyback to $100M3USD/JPY Price Forecast: Does a hammer point to rebound risk near 156.00?4AUD/USD Price Forecast: Can Bulls Break Through the SMA Cluster Towards 0.7100?5Pepe, Pearl top this week’s crypto gainers as Akedo surges 25%6Can the Mexican Peso Avoid a Weekly Loss as It Rebounds Amid Iran Risk?7South Korean Won: Do pullbacks favour a recovery? – OCBC8Philippine Peso: Is oil limiting the bearish bias? – OCBC9Silver Price Forecast: Bears eye $50 after fresh yearly low
LIVE QUOTES

ALL ABOUT TECHNICAL
What Does Smart Money Concept (SMC) Mean, and How Can You Trade It?
What Is an Order Block in Trading and How Can You Trade It?
Average True Range (ATR) Indicator: What Is the Formula, and How Do You Read and Use It?
What Is a Judas Swing? ICT Trading Strategy Explained With Examples
The Real Interest Rate: Are Your Savings Actually Earning Anything?
Butterfly Pattern Trading: How to Identify and Trade the Butterfly Harmonic Pattern
What Is a Rising Wedge Pattern and How Do You Trade It?
What Is a Descending Triangle Pattern and How Do You Trade It?
Accumulation, Manipulation and Distribution (AMD): ICT Power of 3 Trading Guide
Get Started!
Sign up and access the Global Markets in less than 3 minutes

Connect With Us









Contacts
Phone: +61 2 8036 8388
Fax: +61 2 8036 8388
Email: support@tmgm.com



The information provided on this website is of a general nature only and does not constitute personal financial advice. Before acting on any information on this website, you should consider the suitability of the information in relation to your objectives, financial situation and needs. Investing in CFDs and FX Margin Contracts carries significant risks and is not suitable for all investors. You may lose more than your initial deposit. You do not own, or have, any interest in the underlying asset. We recommend that you seek independent advice and ensure you fully understand the risks involved before trading. It is important that you read and consider the disclosure document before you acquire any product listed on the website. The information and advertisements offered on this website are not intended for use by any person in any country or jurisdiction where such use would be contrary to local laws and regulations. The Products and Services offered on this website are not intended for residents of the United States, Malaysia and Thailand.
TMGM is authorized and regulated in various jurisdictions.
Trademax Australia Limited, trading as TMGM, is regulated by the Australian Securities and Investments Commission (ASIC), AFSL no. 436416 and is located at Level 28, One International Tower, 100 Barangaroo Avenue, 2000 Sydney, NSW Australia.
Email: support@tmgm.com.au
Trademax Global Limited, trading as TMGM, is authorized and regulated by the Vanuatu Financial Services Commission (VFSC), registration number 40356 and registered at 1276, Kumul Highway, Port Vila, Vanuatu, Republic of Vanuatu.
Email: support@tmgm.com
Trademax Global Markets (SE) Limited, trading as TMGM, is authorized and regulated by the Financial Services Authority (FSA) of Seychelles, with license number SD224. The company is registered at Office No 13, Providence Estate ABIS Centre, Mahe, Seychelles.
Email: support@tmgm.com
Trademax Global Markets (International) Pty Ltd, trading as TMGM, is authorized and regulated by the Financial Services Commission, Mauritius (FSC) with license no. GB22201012, and registered at 33, Edith Cavell Street C/o IQ EQ Fund Services (Mauritius) Ltd Port Louis, 11324 Mauritius.
Email: support@tmgm.com
Copyright © TMGM. All rights reserved