

Trading
Explore a wide range of markets with competitive pricing, deep liquidity, and advanced trading tools.
Learn More 
Platform
Trade seamlessly with TMGM's powerful platform, built for speed, precision, and a superior trading experience.
Learn More Trading Platform
Academy
Learn the fundamentals of trading with beginner-friendly resources, including guides, webinars, and market insights.
Learn More News & Analysis
Get real-time market updates and expert analysis to stay ahead of trading opportunities
Learn More News & Analysis
About
Learn what sets TMGM apart — our global presence, regulatory strength, and commitment to innovation in trading.
Learn More Why Choose TMGM
Sponsorship
$2,310 test for ETH as Ethereum ETFs approach record monthly outflows
$2,340: Ethereum’s price today
- $2,310 is Ethereum’s average on-chain cost basis. The price is trading near this level, where the 200-day EMA and the cost basis of wallets holding 1K-10K ETH also converge.
- $1.26 billion has flowed out of US spot ETH ETFs on a net basis in October through Monday, approaching the monthly record of $1.42 billion reached in November 2025.
- $2,256 could provide support for ETH should the 200-day EMA give way.
$2,340 was Ethereum’s (ETH) consolidation level on Tuesday. The price remained stable just above $2,300 following last week’s fall. Within a range of about $18 sit three indicators: the $2,310 realised price, the 200-day Exponential Moving Average (EMA) at $2,315 and the $2,328 average cost basis for wallets holding 1K-10K ETH. This convergence has drawn traders’ attention to the area, where a decisive break could prove significant.

$2,310: ETH’s average on-chain cost basis
CryptoQuant puts ETH’s Realised Price, its average on-chain cost basis, at $2,310. During past downtrends, this measure has provided support. Several rebounds over the past three days have also occurred near it.
Buying close to the average cost basis may help investors prevent their holdings from slipping into loss. Conversely, a prolonged break below the realised price could intensify selling as holders seek to limit losses around break-even. Our earlier assessment of ETH’s $2,400 support examines how this level has held.
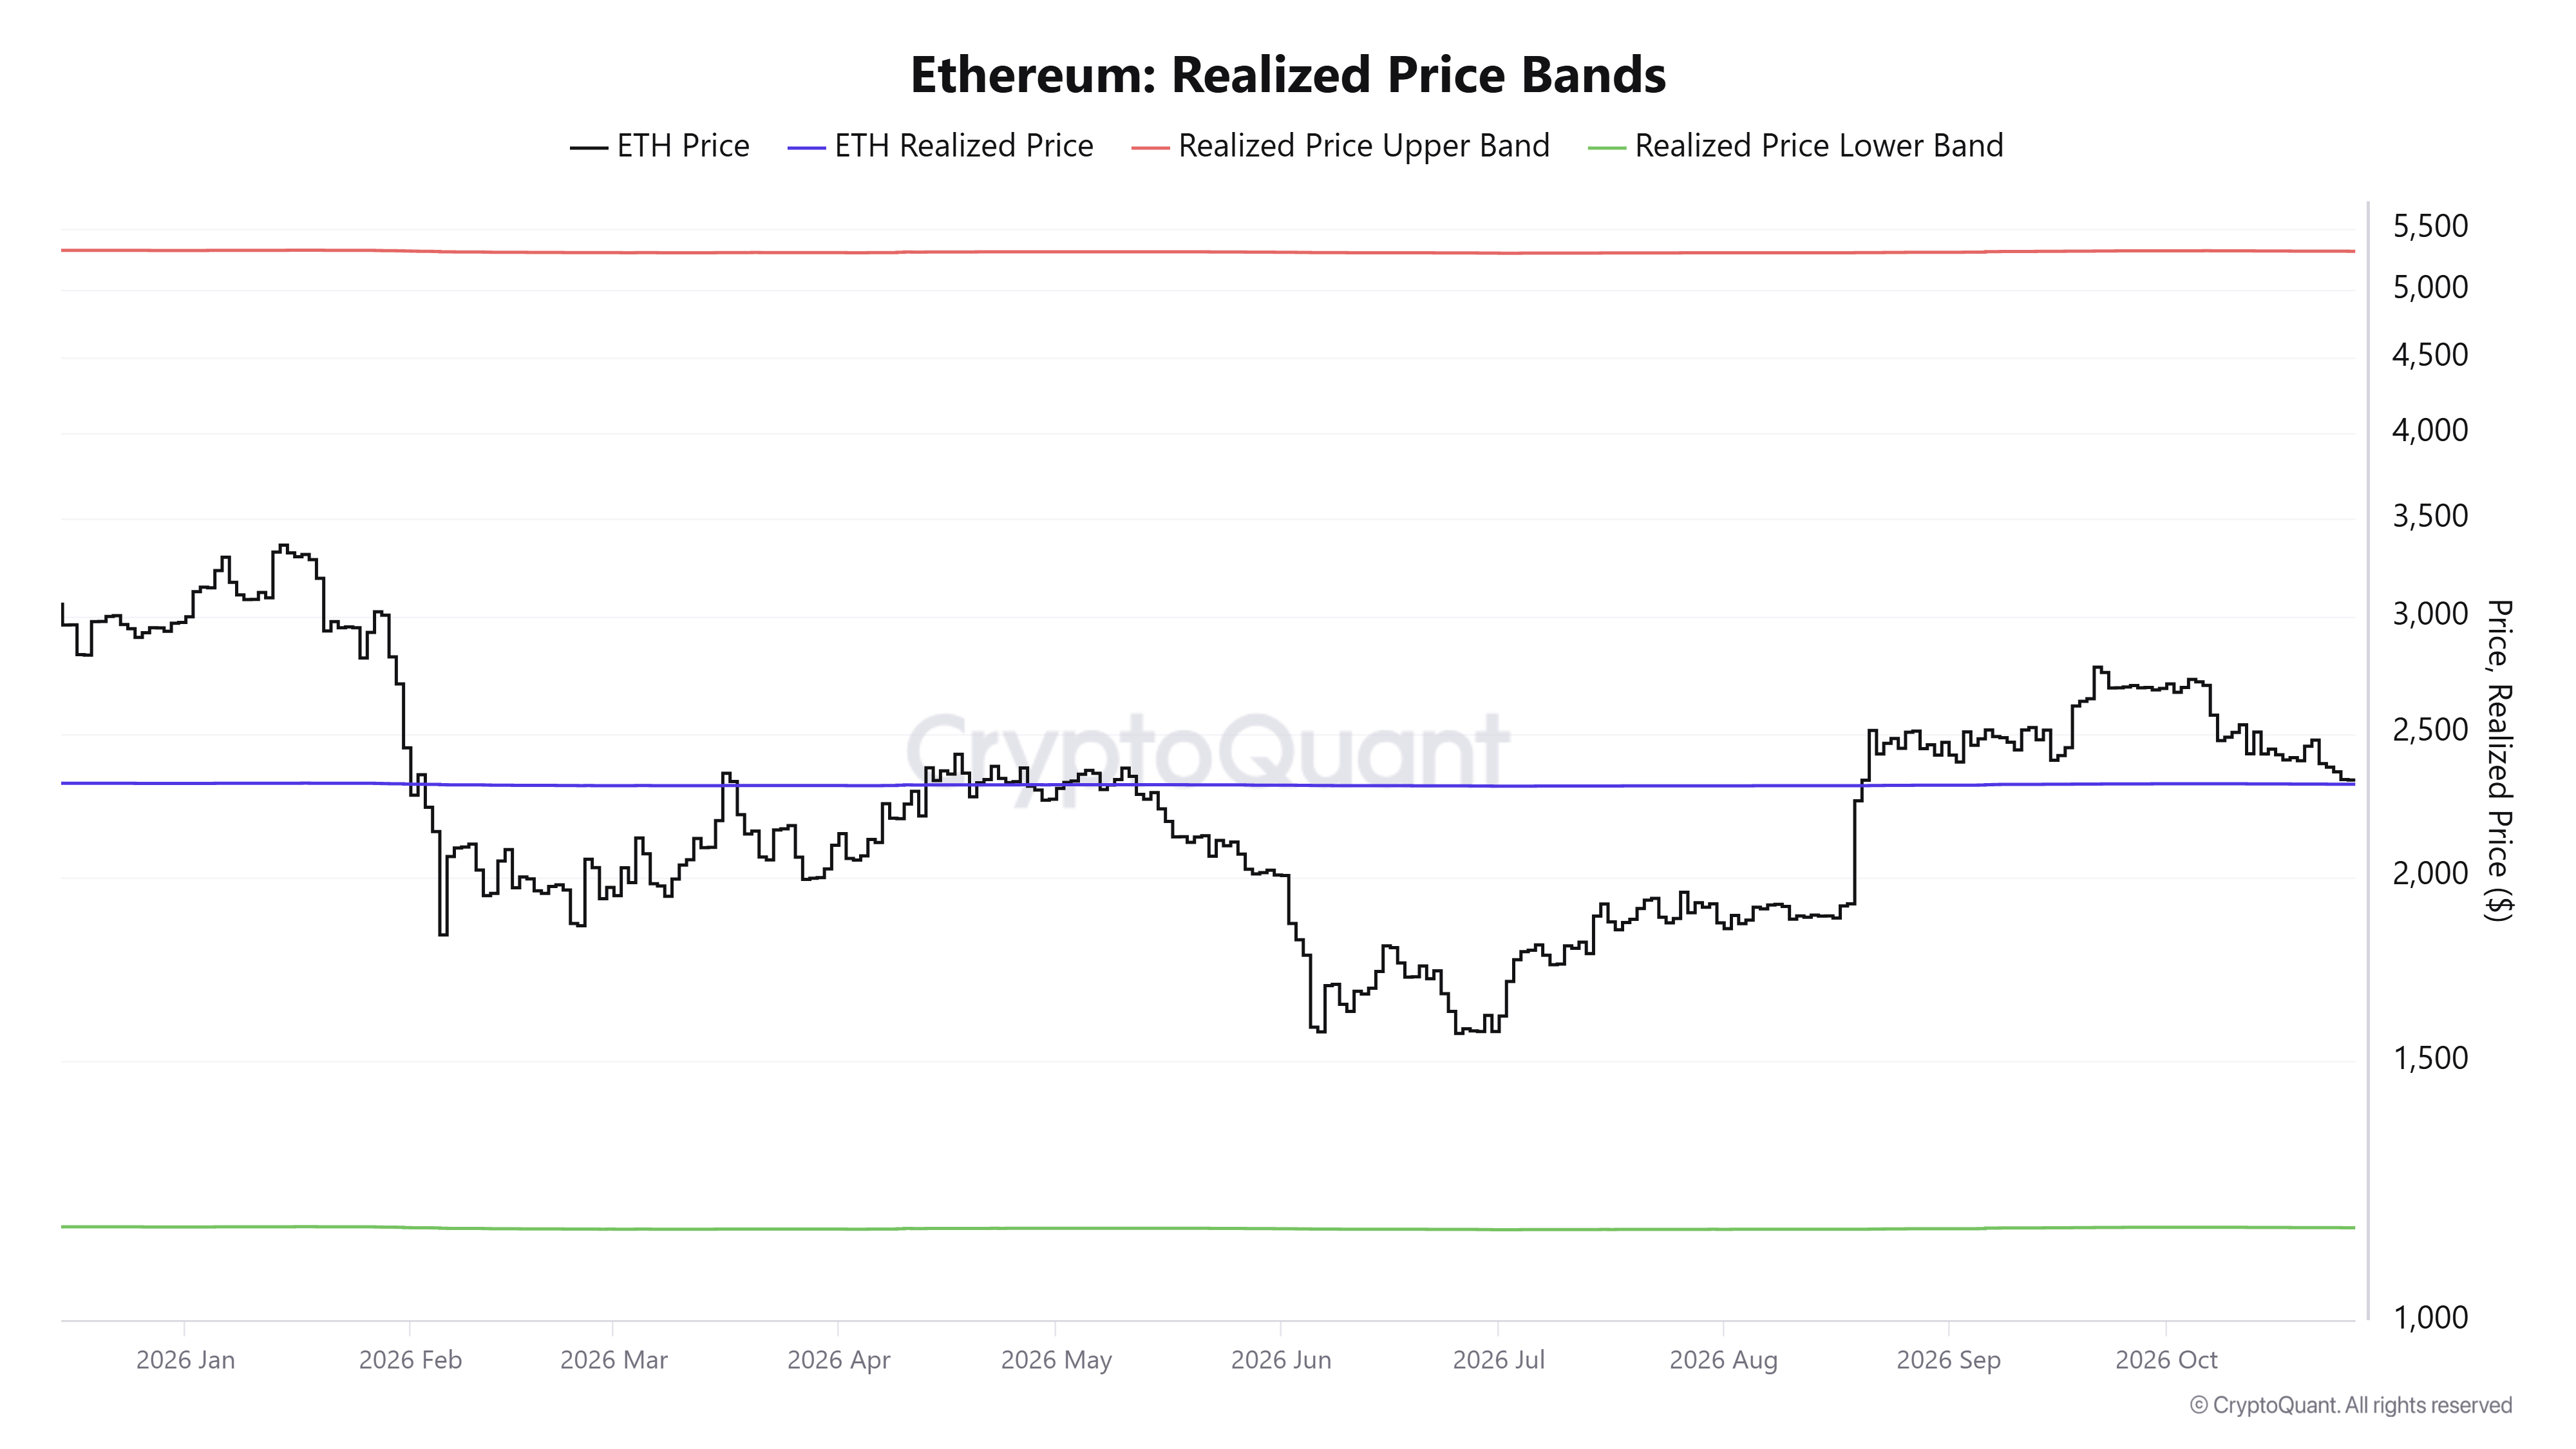
Within the $2,300 area, CryptoQuant also places the average cost basis of wallets holding 1K-10K ETH at $2,328. Historically sensitive to price moves, these wallets have accumulated during rising trends and distributed during declines. Their holdings grew by 40K ETH over the past week, while large holders also maintained their positions.
$1.26 billion in ETH ETF outflows approaches monthly record
Pressure on the market continues from US spot ETH exchange-traded funds (ETFs). SoSoValue data show investors pulled $88.5 million on Monday, 26 October, following net withdrawals of $220.6 million over 19-23 October.
October’s net outflows reached $1.26 billion through Monday, ranking second among monthly totals since the funds launched. Only November 2025, at $1.42 billion, saw larger withdrawals. Further outflows of about $160 million before month-end would put October at a record high.
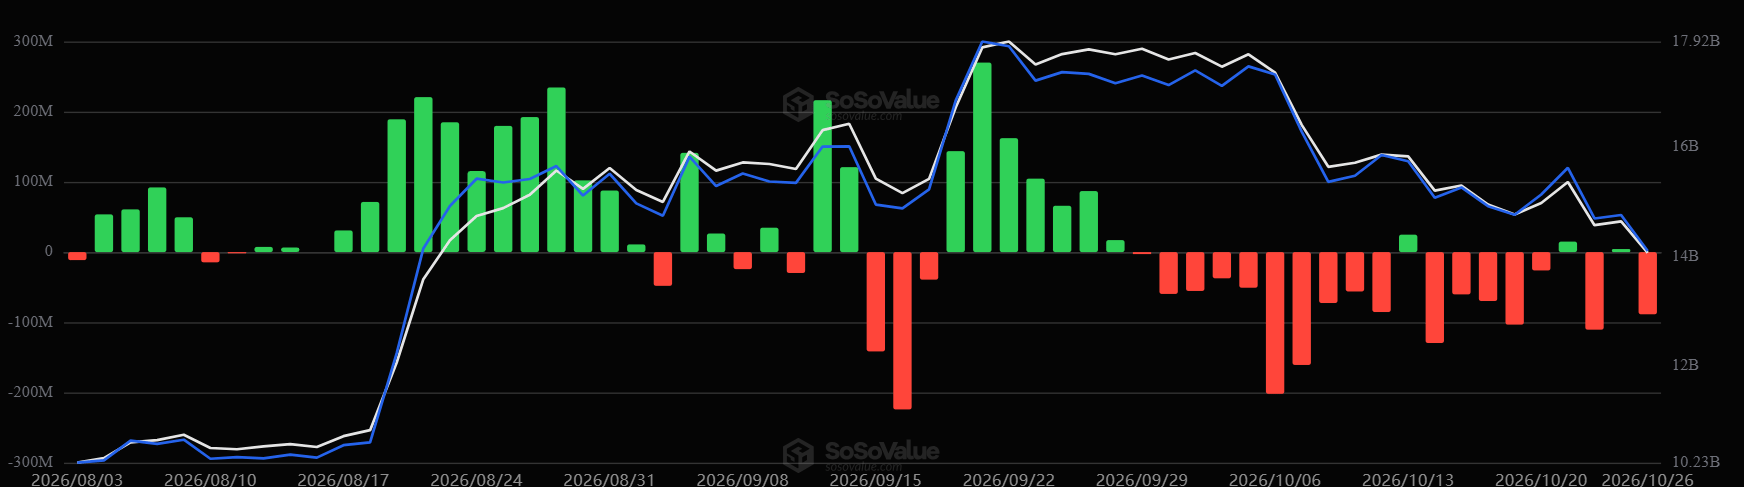
By comparison, US spot BTC ETFs attracted net inflows of $110.3 million on Monday, while net outflows for the month so far stood at $202 million. This suggests net withdrawals from ETH ETFs are roughly 6x those from BTC ETFs, despite Ethereum’s smaller market capitalisation relative to Bitcoin.
200-day EMA under test: Ethereum technical outlook
Coinglass data show $35 million in ETH futures liquidations during the past 24 hours. Short positions accounted for $27 million, leading liquidations even as ETH’s price remained stable that day.
Having held the 200-day EMA on Monday, the leading altcoin is retesting it near $2,315. Should the daily close fall below this average, attention could shift to support at $2,256, $2,204 and $1,971.
Resistance lies at $2,355, followed by the 100-day EMA at $2,362, a level that provided support earlier this month. Beyond these, ETH faces the horizontal level of $2,411, then the 20-day EMA at $2,429 and the 50-day EMA at $2,453. To moderate the bearish bias and clear a path towards $2,548 and $2,636, ETH would need a daily close above this cluster.
At 33 and 16 respectively, the 14-day Relative Strength Index (RSI) and Stochastic Oscillator (Stoch) sit near oversold territory. These readings could temper further declines rather than produce an immediate reversal.
(The technical analysis of this story was written with the help of an AI tool. Know more.)
POPULAR ARTICLES
1Saudi Arabia’s Ras Tanura oil refinery targeted in missile strike, Yemen’s Houthis say2$4,050 breached as gold climbs ahead of Fed rate decision3Indonesian Rupiah: Retracement signals in focus – OCBC4$2,310 test for ETH as Ethereum ETFs approach record monthly outflows5Above 0.7000: Aussie Dollar holds ahead of Fed, RBA and inflation tests6Thai Baht: Weakness against US dollar driven by trade deficit – MUFG7Singapore Dollar: Softer data keep range trading intact – Commerzbank8Anthropic IPO: K33 highlights Bitcoin’s exposure to AI sell-off risk9RBNZ monetary policy decision: What to expect
LIVE QUOTES

ALL ABOUT TECHNICAL
What Is the Dark Cloud Cover Pattern and How Do You Trade It?
What Is the Piercing Line Candlestick Pattern and How Do You Trade It?
What Are Tweezer Top and Bottom Candlestick Patterns?
Inside Bar Candlestick Pattern: What It Is, How to Identify It, and How to Trade It
Hanging Man Candlestick Pattern: How to Identify and Trade It
How to Draw Fibonacci Retracement: Mastering the Golden Ratio in Trading
What is the Relative Strength Index (RSI)
What is Scalping in Trading & How Does It Work
Get Started!
Sign up and access the Global Markets in less than 3 minutes

Connect With Us









Contacts
Phone: +61 2 8036 8388
Fax: +61 2 8036 8388
Email: support@tmgm.com



The information provided on this website is of a general nature only and does not constitute personal financial advice. Before acting on any information on this website, you should consider the suitability of the information in relation to your objectives, financial situation and needs. Investing in CFDs and FX Margin Contracts carries significant risks and is not suitable for all investors. You may lose more than your initial deposit. You do not own, or have, any interest in the underlying asset. We recommend that you seek independent advice and ensure you fully understand the risks involved before trading. It is important that you read and consider the disclosure document before you acquire any product listed on the website. The information and advertisements offered on this website are not intended for use by any person in any country or jurisdiction where such use would be contrary to local laws and regulations. The Products and Services offered on this website are not intended for residents of the United States, Malaysia and Thailand.
TMGM is authorized and regulated in various jurisdictions.
Trademax Australia Limited, trading as TMGM, is regulated by the Australian Securities and Investments Commission (ASIC), AFSL no. 436416 and is located at Level 28, One International Tower, 100 Barangaroo Avenue, 2000 Sydney, NSW Australia.
Email: support@tmgm.com.au
Trademax Global Limited, trading as TMGM, is authorized and regulated by the Vanuatu Financial Services Commission (VFSC), registration number 40356 and registered at 1276, Kumul Highway, Port Vila, Vanuatu, Republic of Vanuatu.
Email: support@tmgm.com
Trademax Global Markets (SE) Limited, trading as TMGM, is authorized and regulated by the Financial Services Authority (FSA) of Seychelles, with license number SD224. The company is registered at Office No 13, Providence Estate ABIS Centre, Mahe, Seychelles.
Email: support@tmgm.com
Trademax Global Markets (International) Pty Ltd, trading as TMGM, is authorized and regulated by the Financial Services Commission, Mauritius (FSC) with license no. GB22201012, and registered at 33, Edith Cavell Street C/o IQ EQ Fund Services (Mauritius) Ltd Port Louis, 11324 Mauritius.
Email: support@tmgm.com
Copyright © TMGM. All rights reserved